Data Labels identify the details of data points in a data series. They are used to ensure that users can easily understand and interpret the information plotted in a chart.
In Spread.Sheets, you can get or set the data labels, change their position and color, and control whether to show the data labels in the chart using the dataLabels method and DataLabelPosition enumeration.
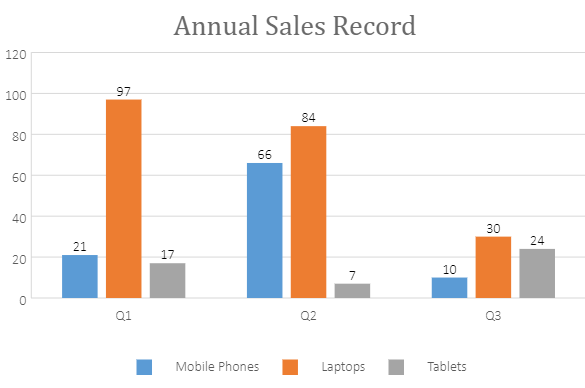
A basic image with data label configuration is shown below.
Using Code
This code shows how to configure data labels in a chart
| JavaScript |
Copy Code
|
|---|---|
|
//Configure DataLabels // This position contains many options. Different chart type applies different position values dataLabels.position = dataLabelPosition.outsideEnd; |
|