Axes refers to the dimensions of the plot area in terms of a horizontal scale(or axis) and a vertical scale (or axis).
In Spread.Sheets, you can get or set the axes of the chart. There are four types of axes in the chart, which includes the primary category axis, the primary value axis, the secondary category axis and the secondary value axis.
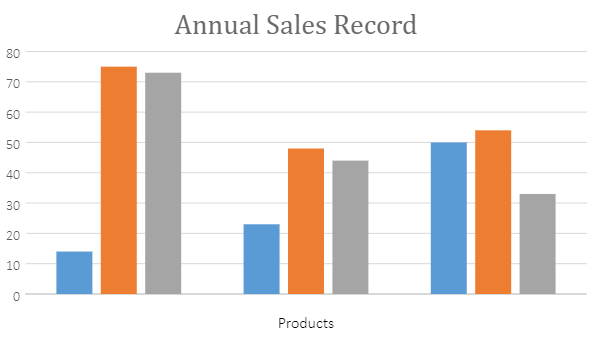
A basic image with Axis configuration of primary category axis and primary value axis is shown below. "Products" refers to the axis title in this image.
Using Code
This code shows how to configure Axes in the chart
| JavaScript |
Copy Code
|
|---|---|
| //Configure Axes var axes = chart.axes(); // Change the style of the axis: color, fontFamily, fontSize axes.primaryValue.lineStyle.color = '#ffffff'; // Change the line style of the axis: color, width axes.primaryCategory.lineStyle.width = 2; //Change the tick position of the axis: majorTickPosition and minorTickPosition axes.primaryCategory.majorTickPosition = GC.Spread.Sheets.Charts.TickMark.none //Change the tick label position of the axis axes.primaryCategory.tickLabelPosition = GC.Spread.Sheets.Charts.TickLabelPosition.none; // Change the format of the axis axes.primaryCategory.format = 'General'; // Change the title of the axis: text, color, fontFamily and font size axes.primaryCategory.title.text = 'Products'; axes.primaryCategory.title.fontSize = 16; axes.primaryCategory.title.color = "black"; |
|