Spread.Services allows you to highlight specific information and see how it varies over time using Sparklines. Sparklines can be understood as small, lightweight charts that are drawn inside cells to quickly visualize data for improved analysis.
Sparklines fit inside a cell and use data from a range of cells which is specified at the time of creating it. Typically, they are placed next to the selected cell range in the spreadsheet in order to enhance readability of data. You can mark data values to depict high, low, first, last, and negative values with distinct colors as per your requirement.
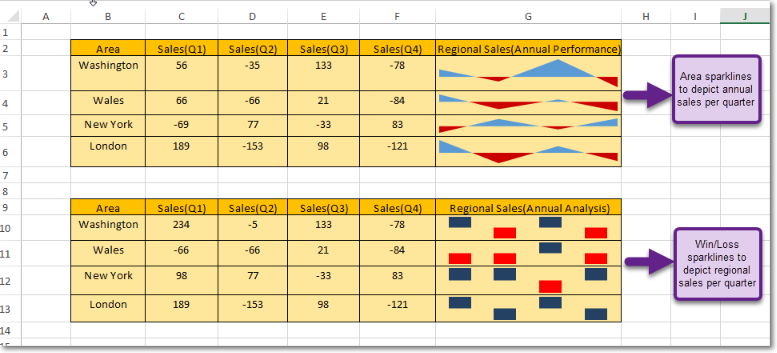
Sparkline
For more information on Sparklines, refer to Use Sparklines in this documentation.