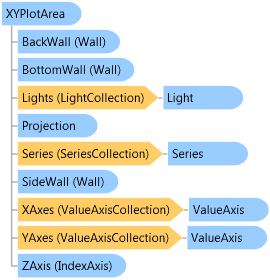
Represents a XY plot area in a chart model.
Object Model
Syntax
'Declaration

Public Class XYPlotArea
   Inherits PlotArea
'Usage

Dim instance As XYPlotArea
public class XYPlotArea : PlotArea
Remarks
The plot area has an x-axis, a y-axis, a z-axis, and up to six walls. The x-axis and y-axis represent values. The z-axis represents series.
Inheritance Hierarchy
System.Object
FarPoint.Win.Chart.PlotArea
FarPoint.Win.Chart.XYPlotArea
Requirements
Target Platforms: Windows 2000 Professional (SP4), Windows 2000 Server, Windows 2003 Server (SP1), Windows Server 2012 R2, Windows 2008, Windows XP (SP2), Windows Vista, Windows 7, Windows 8, Windows 8.1, Windows 10
See Also