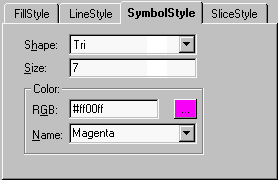
SymbolStyle Tab (ChartStyles)

The Shape dropdown allows you to change the data marker symbol for the plot charts.
Chart2D.ChartGroups.Item(ii).Styles.Item(ii).Symbol.Shape
The Size textbox allows you to specify the size of the data marker symbol.
Chart2D.ChartGroups.Item(ii).Styles.Item(ii).Symbol.Size
Color Area
The RGB textbox lists the RGB value of the outline for a data marker symbol. The ellipsis button next to the textbox opens the customized color pallet.
The Name textbox lists the current color that is being used by the data marker symbol.
Chart2D.ChartGroups.Item(ii).Styles.Item(ii).Symbol.Color