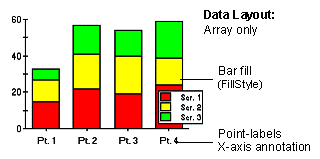
Stacking Bar Charts
A stacking bar chart draws each series as a portion of a stacked bar cluster, the number of clusters being the number of points in the data. Each bar displays the nth data point in each series. Positive values are displayed above the X-axis, and negative values are displayed below the X-axis. Using ChartStyles, you customize the fill properties of each series. You can also customize bar cluster properties and 3D display properties.
To Change the Chart Type
Use the ChartType property to set the chart type for one ChartGroup. ChartType is located on the General Tab (ChartGroups) on the Property Pages. Use the ChartType dropdown to select the appropriate chart.
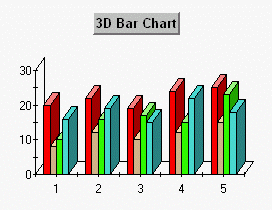
Bar Chart 3D Effects
ComponentOne Chart’s 3D effects can be used with bar charts or stacking bar charts to create the illusion of depth with each data series. By using the Depth, Elevation, Rotation and Shading properties, you can enhance your bar charts, making them stand out by creating visual depth as shown below.
To access the 3D view for a bar chart, activate the Property Editor View3D Page. The General Tab (View3D) allows you to modify the Depth, Elevation, Rotation and Shading properties by typing a value in the appropriate textbox.
Note that the Depth property is the key to all 3D type chart logic. While the Elevation and Rotation properties modify the way a user views the chart, it is the Depth property that actually dictates whether a chart is 3D. By using a non zero value for the depth property and setting the elevation and rotation property values to zero, you have created a 3D chart even though nothing seems to have changed. In effect you are looking at the “front” surface of the chart which is visually represented in the same way as a standard bar chart.