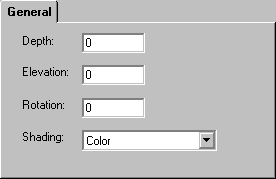
General Tab (View3D)

The Depth textbox specifies the depth of the chart 3D effect, as a percentage of the total width of the chart. This must be greater than zero to display any 3D effect.
Chart2D.ChartArea.View3D.Depth
The Elevation textbox specifies the elevation angle of the 3D effect, as degrees above the X-axis.
Chart2D.ChartArea.View3D.Elevation
The Rotation textbox specifies the rotation angle of the 3D effect, as degrees to the right of the Y-axis.
Note: This has no effect on pie charts.
Chart2D.ChartArea.View3D.Rotation
The Shading dropdown allows you to format the shading effects for the “surfaces” of the 3D chart.
Chart2D.ChartArea.View3D.Shading
Note: The Depth:View3D property is the key to all 3D type chart logic. While the Elevation and Rotation properties modify the way a user views the chart, it is the Depth property that actually dictates whether a chart is 3D. By using a non zero value for the depth property and setting the elevation and rotation property values to zero, you have created a 3D chart even though nothing seems to have changed. In effect you are looking at the “front” of the chart.