Polar Charts
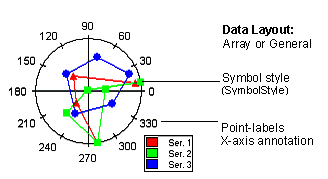
A polar chart draws the x and y coordinates in each series as (theta,r), where theta is amount of rotation from the origin and r is the distance from the origin. theta may be specified in either degrees (default), radians or grads. Since the x-axis is a circle, the x-axis maximum and minimum values are fixed. The series can be drawn independently, or stacked.
Using ChartStyles, you can customize the line and symbol properties of each series.
Use the ChartGroupobject’s IsStacked property to create a stacking Polar chart. Stacking charts represent the data by stacking the values for each series on top of the values from the previous series.
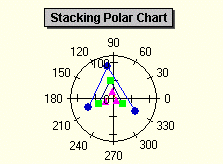
For more information on stacking charts, see Creating Stacking Charts.
To Change the Chart Type
Use the ChartType property to set the chart type for one ChartGroup. ChartType is located on the General Tab (ChartGroups) on the Property Pages.