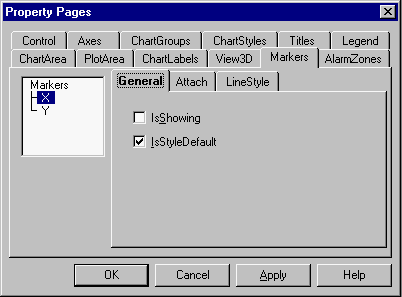
Markers Page
A marker is a vertical or horizontal line drawn on top of the chart to identify a particular data point or chart coordinate. This page lists the currently defined properties for the chart Markers and allows you to modify them as required. You can modify each marker by highlighting the specific axis in the left pane then choosing the inner tab and property you wish to change.

For more information, see Adding Markers.
 General Tab (Markers)