HiLo Charts
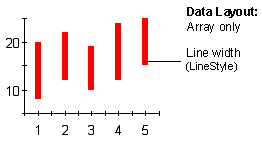
A HiLo chart combines 2 series to form a logical data set. HiLo charts are used primarily in financial applications to show the high and low price for a given stock. The first series of each pair in a HiLo chart represents the "high" value, and the second represents the "low" value.
Using ChartStyles, you can customize the fill and line properties of each series.
To Change the Chart Type
Use the ChartType property to set the chart type for one ChartGroup. ChartType is located on the General Tab (ChartGroups) on the Property Pages. Use the ChartType dropdown to select the appropriate chart.
Programming Considerations
The 2 different series used to draw a HiLo chart creates a "logical" data set. When programming chart labels, point and set labels and markers, make sure you refer to this logical data set, and not the individual series themselves. For example, if there are 4 series forming 2 different HiLo bars, series 0 refers to the first logical data set, and series 1 refers to the second logical data set.