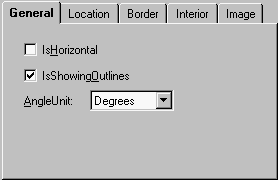
General Tab (ChartArea)

When selected (checked), the IsHorizontal checkbox sets the IsHorizontal property so that the X-axis and Y-axis are reversed, making the chart appear horizontal.
Chart2D.ChartArea.IsHorizontal
For more information, see Chart Orientation and Axis Direction.
When selected (checked), the IsShowingOutlines checkbox sets the IsShowingOutlines property so that lines are shown around the chart objects (bars, pie sections, etc.).
Note: This property is only functional with bar, pie, stacking bar, area and filled radar charts.
Chart2D.ChartArea.IsShowingOutlines
The AngleUnit dropdown allows you to format the chart angles for degrees, radiants and grads.
Note: This property is only functional with polar, radar and filled radar charts.
Chart2D.ChartArea.AngleUnit