Data Tab (ChartGroups)
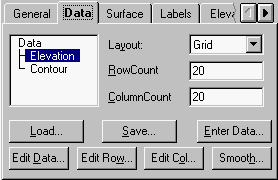
The Layout dropdown specifies the format of the chart data.
Note: Changing Layout deletes any data displayed in the chart.
Chart2D.ChartGroups.Item(ii).Layout
The Hole textbox specifies the value that represents missing data values, or holes.
Chart2D.ChartGroups.Item(ii).Data.HoleValue
The NumSeries textbox specifies the number of series in the data.
Chart2D.ChartGroups.Item(ii).Data.NumSeries
The NumPoints textbox specifies the number of points in the data.
Chart2D.ChartGroups.Item(ii).Data.NumPoints
The XValue textbox list the X data value at ThisSeries and ThisPoint. You can edit this value.
Chart2D.ChartGroups.Item(ii).Data.X
The YValue textbox lists the Y data value at ThisSeries and ThisPoint. You can edit this value.
Chart2D.ChartGroups.Item(ii).Data.Y
The ThisSeries textbox selects a data series to view or edit. Use with ThisPoint to select a particular data point. XValue and YValue display the X and Y coordinates at this series/point.
The ThisPoint textbox selects a data point to view or edit. Use with ThisSeries to select a particular data point. XValue and YValue display the X and Y coordinates at this series/point.
The Load button allows you to load new data into the selected ChartGroup.
Chart2D.ChartGroups.Item(ii).Data.Load
The Save button allows you to save the selected ChartGroup’s data to a file.
Chart2D.ChartGroups.Item(ii).Data.Save
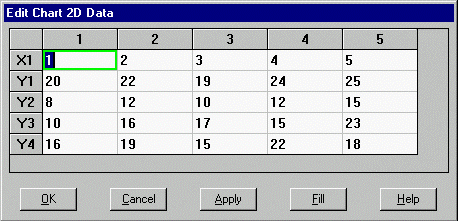
The Edit button allows you to edit the 2D chart data in the Edit 2D Chart Data window.
The Series button allows you to show, hide or exclude each data series in a chart.
Chart2D.ChartGroups.Item(ii).Data.SeriesDisplay
The Sort button allows you to sort the points in each series from lowest to highest X value.
Chart2D.ChartGroups.Item(ii).Data.Sort
 Edit Chart 2D Series