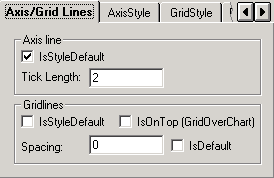
Axis/GridLines Tab (Axes)

When selected (checked), the IsStyleDefault checkbox returns the axis tick line to the default length.
Chart2D.ChartArea.Axes.Item(ii).AxisStyle.IsStyleDefault
The Tick Length: textbox allows you to specify the length of the tick marks along the axis.
Chart2D.ChartArea.Axes.Item(ii).AxisStyle.TickLength
Gridlines Area
When selected (checked), the IsStyleDefault checkbox returns the GridStyle to the default. If this option is disabled, it does not apply to the selected axis.
Chart2D.ChartArea.Axes.Item(ii).MajorGrid.IsStyleDefault
The Spacing textbox allows you to specify the increment between each gridline.
Chart2D.ChartArea.Axes.Item(ii).MajorGrid.Spacing.Value
When selected (checked), the IsDefault checkbox causes the chart to automatically control the spacing. If this option is disabled, it does not apply to the selected axis.
Chart2D.ChartArea.Axes.Item(ii).MajorGrid.Spacing.IsDefault
When selected (checked), the IsOnTop checkbox causes the gridlines to display on top of the chart.
Chart2D.ChartArea.Axes.Item(ii).MajorGrid.IsOnTop
For more information, see Adding Grid Lines.