Adding Grid Lines
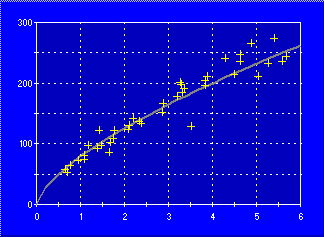
Displaying a grid on a chart can make it easier to see the exact value of data points. You can set the spacing between lines on the grid, and define how the grid looks.

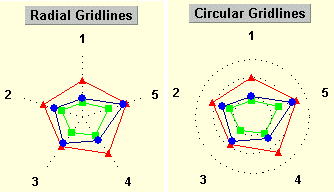
Horizontal gridlines are a property of the Y-axis. Vertical gridlines are a property of the X-axis. You cannot set grid properties on the Y2-axis. For polar and radar charts, circular gridlines are a property of the Y-axis. Radial gridlines are a property of the X-axis. The following charts show the difference between radial and circular gridlines:

 Grid Spacing