Attaching and Positioning ChartLabels
When you define a ChartLabel, you need to specify how to attach it to the chart and where to position it relative to its attachment point.
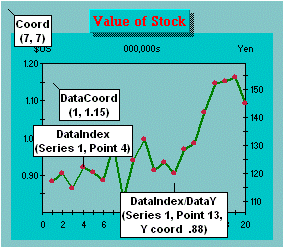
The attachment method you choose depends on what you are using the ChartLabel for. The following illustrates and describes the valid attachment methods:

· Coord attaches to anywhere on the chart. You specify the number of pixels between the top-left corner of the chart to the ChartLabel.
· DataCoord attaches to anywhere inside the PlotArea. You specify the data coordinates. This method is not allowed on pie charts using PointLabels for the X-axis annotation. If any part of the ChartLabel falls outside of the ChartArea, it is clipped.
· DataIndex attaches to a specific data point on the chart. You specify the series and point indices, and the ChartGroup.
· DataIndex & Data Y attaches to a distance above or below a specific data point. You specify the series and point indices, the ChartGroup, and the Y-coordinate. This is most useful for bar and stacking bar charts.
Use the AttachMethod ChartLabel property to set the attachment method, and the AttachCoord, AttachDataCoord, or AttachDataIndex properties to set the attachment point. These properties are located on their own dialog on the General Tab (ChartLabels) on the Property Pages. Click the AttachMethod button to display the dialog.
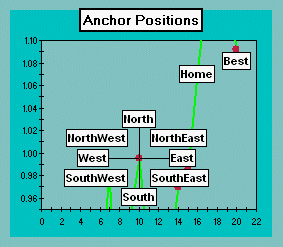
Once attached to a point on the chart, you can choose the anchoring position that works best for that ChartLabel. The following shows the valid anchoring positions:

Use the Anchor ChartLabel property to specify where to position the ChartLabel relative to its attachment point. In addition to the eight compass points, you can choose “Home” to center the ChartLabel over its attachment point or “Best” to allow the chart to determine the best position. Anchor is located on the General Tab (ChartLabels) on the Property Pages.