Area Charts
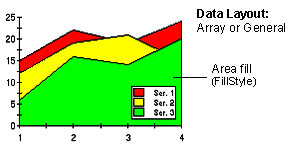
An area chart draws each series as connected points of data, filled below the points. Each series is drawn “on top” of the preceding series. The series can be drawn independently, or stacked. Using ChartStyles, you can customize the fill properties of each series.
Use the ChartGroupobject’s IsStacked property to create a stacking Area chart. Stacking charts represent the data by stacking the values for each series on top of the values from the previous series.
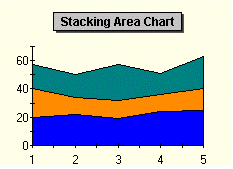
For more information on stacking charts, see Creating Stacking Charts.
To Change the Chart Type
Use the ChartType property to set the chart type for one ChartGroup. ChartType is located on the General Tab (ChartGroups) on the Property Pages. Use the ChartType dropdown to select the appropriate chart.
Area Chart 3D Effects
ComponentOne Chart’s 3D effects can be used with area charts or stacking area charts to create the illusion of depth with each data series. By using the Depth, Elevation, Rotation and Shading properties, you can enhance your area charts, making them stand out by creating visual depth as shown below.
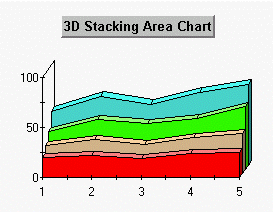
To access the 3D view for an area chart, activate the Property Pages View3D Page. The General Tab (View3D) allows you to modify the Depth, Elevation, Rotation and Shading properties by typing a value in the appropriate textbox.
Note that the Depth property is the key to all 3D type chart logic. While the Elevation and Rotation properties modify the way a user views the chart, it is the Depth property that actually dictates whether a chart is 3D. By using a non zero value for the depth property and setting the elevation and rotation property values to zero, you have created a 3D chart even though nothing seems to have changed. In effect you are looking at the “front” surface of the chart which is visually represented in the same way as a standard area chart.