The C1FlexGrid.Subtotal method adds subtotal rows that contain aggregate data for the regular (non-subtotal) rows.
Subtotal supports hierarchical aggregates. For example, if your grid contains sales data, you may Subtotal to get aggregate sales figures by Product, Region, and Salesperson. The code below illustrates this:
To write code in Visual Basic
| Visual Basic |
Copy Code
|
|---|---|
Private Sub ShowTotals()

    '  Show OutlineBar on column 0.
    _flex.Tree.Column = 0
    _flex.Tree.Style = TreeStyleFlags.Simple

    '  Clear existing subtotals.
    _flex.Subtotal(AggregateEnum.Clear)

    '  Get a Grand total (use -1 instead of column index).
    _flex.Subtotal(AggregateEnum.Sum, -1, -1, 3, "Grand Total")

    '  Total per Product (column 0).
    _flex.Subtotal(AggregateEnum.Sum, 0, 0, 3, "Total {0}")

    '  Total per Region (column 1).
    _flex.Subtotal(AggregateEnum.Sum, 1, 1, 3, "Total {0}")

    '  Size column widths based on content.
    _flex.AutoSizeCols()
End Sub
|
|
To write code in C#
| C# |
Copy Code
|
|---|---|
private void ShowTotals()
{
    // Show OutlineBar on column 0.
    _flex.Tree.Column = 0;
    _flex.Tree.Style = TreeStyleFlags.Simple;

    // Clear existing subtotals.
    _flex.Subtotal(AggregateEnum.Clear);

    // Get a Grand total (use -1 instead of column index).
    _flex.Subtotal(AggregateEnum.Sum, -1, -1, 3, "Grand Total");

    // Total per Product (column 0).
    _flex.Subtotal(AggregateEnum.Sum, 0, 0, 3, "Total {0}");

    // Total per Region (column 1).
    _flex.Subtotal(AggregateEnum.Sum, 1, 1, 3, "Total {0}");

    // Size column widths based on content.
    _flex.AutoSizeCols();
}
|
|
When the C1FlexGrid.Subtotal method adds rows with the aggregate information, it automatically assigns subtotal styles to the new rows (there are built-in styles for 5 levels of subtotals). You can customize the appearance of the subtotal rows by changing the properties of the outline styles in the designer with the Style Editor or with code. For example:
To write code in Visual Basic
| Visual Basic |
Copy Code
|
|---|---|
' Set styles for subtotals. Dim cs As C1.Win.C1FlexGrid.CellStyle cs = _flex.Styles(C1.Win.C1FlexGrid.CellStyleEnum.GrandTotal) cs.BackColor = Color.Black cs.ForeColor = Color.White cs.Font = New Font(Font, FontStyle.Bold) cs = _flex.Styles(C1.Win.C1FlexGrid.CellStyleEnum.Subtotal0) cs.BackColor = Color.DarkRed cs.ForeColor = Color.White cs.Font = New Font(Font, FontStyle.Bold) cs = _flex.Styles(C1.Win.C1FlexGrid.CellStyleEnum.Subtotal1) cs.BackColor = Color.DarkBlue cs.ForeColor = Color.White |
|
To write code in C#
| C# |
Copy Code
|
|---|---|
// Set styles for subtotals. CellStyle cs; cs = _flex.Styles[CellStyleEnum.GrandTotal]; cs.BackColor = Color.Black; cs.ForeColor = Color.White; cs.Font = new Font(Font, FontStyle.Bold); cs = _flex.Styles[CellStyleEnum.Subtotal0]; cs.BackColor = Color.DarkRed; cs.ForeColor = Color.White; cs.Font = new Font(Font, FontStyle.Bold); cs = _flex.Styles[CellStyleEnum.Subtotal1]; cs.BackColor = Color.DarkBlue; cs.ForeColor = Color.White; |
|
After executing this code, the grid would look like this:
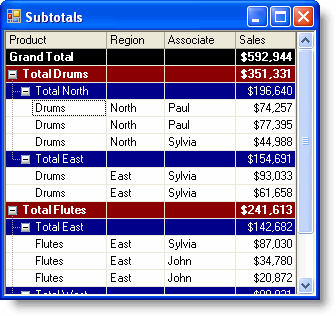
The Grand Total row contains the total sales for all products, regions, and sales personnel. It was created using a –1 for the groupOn parameter in the call to the C1FlexGrid.Subtotal method. The other subtotals show total sales by product and region. They were created using a values 0 and 1 for the groupOn parameter.
For information on grouping, please refer Grouping.
You may also calculate aggregates other than sums (for example, averages or percentages), and calculate several aggregates for each row (for example, gross and net sales).
Subtotal rows created by the Subtotal method differ from regular rows in three aspects:
- Subtotal rows can be automatically removed by invoking the Subtotal method with the flexSTClear parameter. This is useful to provide dynamic views of the data, where the user may move columns and re-sort the data, making it necessary to recalculate the subtotals.
- Subtotal rows can be used as nodes in an outline, allowing you to collapse and expand groups of rows to present an overview of the data or to reveal its details. To see the outline tree, you need to set the Column and Tree.Style properties to define the position and appearance of the outline tree.
- Subtotal rows can be treated as nodes in a tree. You can get a Node object for any subtotal row through the Node property.
- When the grid is bound to a data source, the subtotal rows do not correspond to actual data. If you move the cursor in the data source, subtotal rows will be skipped in the grid.
The outline tree allows users to collapse and expand sections of the grid by clicking on the nodes. You can use outline trees to display many types of information, not only aggregates. The next topic shows how you can create a custom outline tree to display directory information.