One of the unique and popular features of the C1FlexGrid control is the ability to add hierarchical grouping to regular unstructured data.
To achieve this, the C1FlexGrid introduces the concept of Node rows. Node rows do not contain regular data. Instead, they act as headers under which similar data is grouped, exactly like nodes in a regular TreeView control. Like nodes in a TreeView control, node rows can be collapsed and expanded, hiding or showing the data they contain. Also like nodes in a TreeView control, node rows have a Level property that defines the node hierarchy. Lower level nodes contain higher level nodes.
For example, suppose you had a grid showing customer name, country, city, and sales amounts. This typical grid would normally look like this:
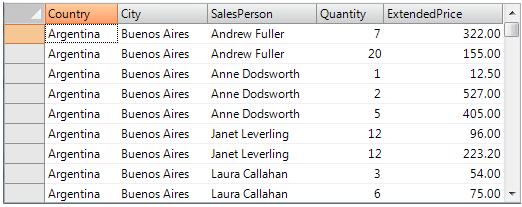
All the information is there, but it's hard to see the total sales for each country or customer. You could use the C1FlexGrid's outlining features to group the data by country (level 0), then by city within each country (level 1), then by customer within each city (level 2). Here is the same grid with after adding the outline:
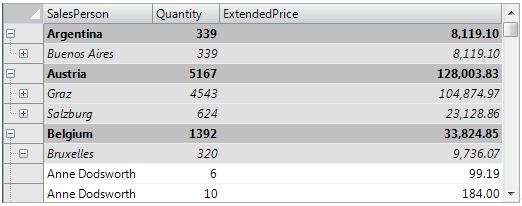
This grid shows the same information as the previous one (it is bound to the same data source), but it adds a tree where each node contains a summary of the data below it. Nodes can be collapsed to show only the summary, or expanded to show the detail. Note that each node row can show summaries for more than one column (in this case, total units sold and total amount).
In this article, we will walk you through the process of turning a regular grid into a richer outline grid.