ComponentOne FlexChart for WinForms
Multiple Axis
FlexChart > Working with FlexChart > FlexChart Elements > Axis > Multiple Axis

Although a chart contains primary X and Y axis, you may still sometimes require additional axis to fulfill your requirements. For example, you may want to plot series of a significantly different range of values in a chart. In addition, you may want to plot entirely different values (of different types) within a single chart. With just two axis, it would not be possible to display data in such scenarios effectively. In such cases, using secondary axis would come in handy. To use secondary axis, you can plot multiple series in a single chart with their own X and Y axis.

FlexChart allows you to work with multiple axis easily. You just need to create additional axis as per your requirements, and then bind the same to the AxisX and the AxisY property of a series.

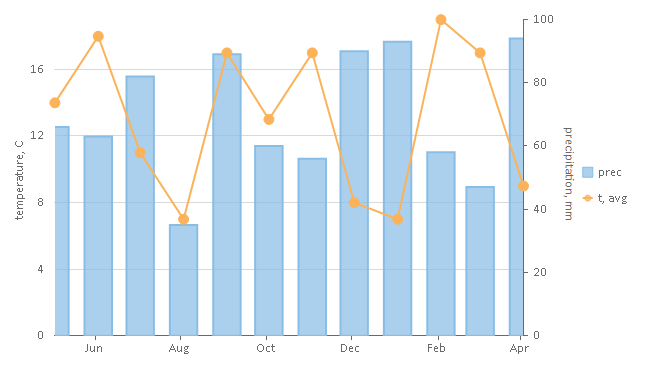
The following image shows two Y axis. one primary and another auxiliary, along with X axis in FlexChart.

The following code snippet demonstrates how you can create and use multiple Axis in FlexChart:

Partial Public Class Form1
    Inherits Form
    Private npts As Integer = 12
    Private rnd As New Random()
    Public Sub New()
        InitializeComponent()

        ' Create sample data
        Dim data = New List(Of DataItem)()
        Dim dt = DateTime.Today
        For i As Object = 0 To npts - 1
            data.Add(New DataItem() With {
                .Time = dt.AddMonths(i),
                .Precipitation = rnd.[Next](30, 100),
                .Temperature = rnd.[Next](7, 20)
            })
        Next

        FlexChart1.BeginUpdate()
        FlexChart1.Series.Clear()

        ' 1st series with auxiliary axis
        Dim series1 = New Series()
        series1.Name = "prec"
        series1.Binding = "Precipitation"
        series1.ChartType = ChartType.Column
        series1.AxisY = New Axis() With {
            .Position = Position.Right,
            .Min = 0,
            .Max = 100,
            .Title = "precipitation, mm"
        }

        ' 2nd series
        Dim series2 = New Series()
        series2.Name = "t, avg"
        series2.Binding = "Temperature"
        series2.ChartType = ChartType.LineSymbols

        ' Add data to the chart
        FlexChart1.Series.Add(series1)
        FlexChart1.Series.Add(series2)
        FlexChart1.BindingX = "Time"
        FlexChart1.DataSource = data


        FlexChart1.ChartType = ChartType.Column

        ' Set axis appearance
        FlexChart1.AxisY.Title = "temperature, C"
        FlexChart1.AxisY.Min = 0
        FlexChart1.AxisY.MajorGrid = True
        FlexChart1.EndUpdate()
    End Sub
    Public Class DataItem
        Public Property Time() As DateTime
            Get
                Return m_Time
            End Get
            Set
                m_Time = Value
            End Set
        End Property
        Private m_Time As DateTime

        Public Property Precipitation() As Integer
            Get
                Return m_Precipitation
            End Get
            Set
                m_Precipitation = Value
            End Set
        End Property
        Private m_Precipitation As Integer
        Public Property Temperature() As Integer
            Get
                Return m_Temperature
            End Get
            Set
                m_Temperature = Value
            End Set
        End Property
        Private m_Temperature As Integer
    End Class
End Class
public partial class Form1 : Form
{
    int npts = 12;
    Random rnd = new Random();
    public Form1()
    {
        InitializeComponent();

        // Create sample data
        var data = new List<DataItem>();
        var dt = DateTime.Today;
        for (var i = 0; i < npts; i++)
        {
            data.Add(new DataItem()
            {
                Time = dt.AddMonths(i),
                Precipitation = rnd.Next(30, 100),
                Temperature = rnd.Next(7, 20)
            });
        }

        flexChart1.BeginUpdate();
        flexChart1.Series.Clear();

        // 1st series with auxiliary axis
        var series1 = new Series();
        series1.Name = "prec";
        series1.Binding = "Precipitation";
        series1.ChartType = ChartType.Column;
        series1.AxisY = new Axis()
        {
            Position = Position.Right,
            Min = 0,
            Max = 100,
            Title = "precipitation, mm"
        };

        // 2nd series
        var series2 = new Series();
        series2.Name = "t, avg";
        series2.Binding = "Temperature";
        series2.ChartType = ChartType.LineSymbols;

        // Add data to the chart
        flexChart1.Series.Add(series1);
        flexChart1.Series.Add(series2);
        flexChart1.BindingX = "Time";
        flexChart1.DataSource = data;


        flexChart1.ChartType = ChartType.Column;

        // Set axis appearance
        flexChart1.AxisY.Title = "temperature, C";
        flexChart1.AxisY.Min = 0;
        flexChart1.AxisY.MajorGrid = true;
        flexChart1.EndUpdate();
    }
    public class DataItem
    {
        public DateTime Time { get; set; }

        public int Precipitation { get; set; }
        public int Temperature { get; set; }
    }
See Also