The Charting sample consists of a form with the ActiveReports Viewer control to display the report, and an ActiveReport with two Chart controls, one bound and one unbound.
rptCharting
The GroupHeader section has its NewPage property set to After. This causes the Detail section to print on a new page.
ChartSalesCategories
The chart in the GroupHeader section gets its data from the chart data source. To see the data source, select the chart, and in the verbs section of the Properties window, click Data Source. If you have trouble with this, see Access the Chart Wizard and Data Source for help.
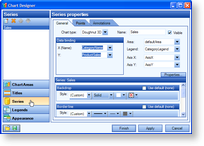
Also in the verbs section of the Properties window, click Customize to open the Chart Designer window. Click the Series tab to see the fields bound to the X and Y axes. Also on that tab, you can see that the Chart type is set to Doughnut 3D. Scroll down to see the Marker settings that label each slice of the pie in the chart.
 |
Click the Legends tab to see which settings are used to set up the legend at the bottom of the chart. The Titles tab is where the title at the top of the report is set, and the Appearance tab is where the colors of the chart are set.
You can also access all of these properties in the Properties window by clicking the ellipsis button that appears when you select the property.
 |
ChartUnbound
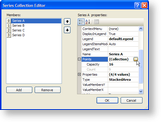
The chart in the Detail section is not connected to data. Instead, values for data points are set in the Series Collection Editor dialog. To open the dialog, click the chart to select it and in the Properties window, click the Series property to display the ellipsis button (see image above). Click the ellipsis button to open the dialog.
 |
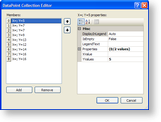
Here you can see the four series in the chart, A through D. Scroll down in the properties for one of the series, and you can see that the chart Type (in this case, StackedArea) can be set for each series. Select the Points property. Click the ellipsis button that appears next to it to open the DataPoint Collection Editor dialog where the Y value for each data point is entered.
 |
Close both dialogs to return to the chart, and in the Properties window, expand the Backdrop property to see the settings used to create the gradient blue backdrop for the chart. Click the ellipsis button next to the Titles property to find where the header and footer titles are set.
For more information on creating charts, see the Create Charts topic and the Chart Walkthroughs section.
ViewerForm
The ViewerForm contains the ActiveReports Viewer control, with its Dock property set to Fill. This enables the viewer to automatically resize along with the form. Right-click the form and select View Code to see the three lines of code used to run the report and display it in the viewer.