Normally you can filter your data using parameters in a query, but if your data source does not support parameters you can use filters. You can set filters on the following:
- DataSet
- Data Region
- Groups in a Data Region
In a Page Report, you can also set filters on the page through the FixedPage dialog.
Use the following steps to create filters in a page report and RDL report. These steps assume that you have already added a Page Report/RDL Report template and have a data connection and a dataset in place. See Adding an ActiveReport to a Project, Connect to a Data Source and Add a Dataset for more information.
To set filters on a DataSet
When you set a filter on a dataset, any control you add to the design surface can utilize this filtered data.
- In the Report Explorer, right-click the DataSet node and select Edit.
- In the DataSet dialog that appears, select the Filters page and click the Add (+) icon to add a new filter for the data set. By default, an empty filter expression gets added to the filter list.
- Under Expression, enter an expression or use the Expression Editor to provide the expression on which to filter data. For example,
=Fields!YearReleased.Value - Under Operator, select an operator from the list to decide how to compare the Expression with the Value. For example, set a GreaterThan operator on the Expression above. See Filtering for a list of available operators and their description.
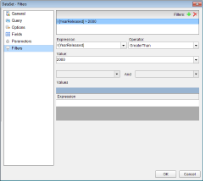
- Under Value, enter a value or set an expression using the Expression Editor with which to compare the expression results. For example, 2000 to represent the year 2000.
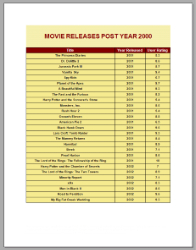
The resultant filter looks like the following.
=Fields!YearReleased.Value > 2000
To set filters in a Data Region
When you set a filter in a data region, you can limit the amount of data available for use inside that data region.
- With the data region selected on the report, under the Properties window, click the Property dialog link. This is a command to open the corresponding data region dialog. See Properties Window for more on how to access commands.
Note: In a Classic Chart data region, right-click the data region and choose the Chart data option to open the Chart Data dialog. - In the data region dialog that appears, select the Filters page and click the Add (+) icon to add a new filter for the data region. By default, an empty filter expression gets added to the filter list.
- Under Expression, enter an expression or use the Expression Editor to provide the expression on which to filter data. For example,
=Fields!UserRating.Value - Under Operator, select an operator from the list to decide how to compare the Expression with the Value. For example, set a LessThan operator on the Expression above. See Filtering for a list of available operators and their description.
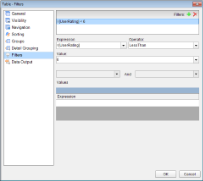
- Under Value, enter a value or set an expression using the Expression Editor with which to compare the expression results. For example, 6 to represent the Rating 6.
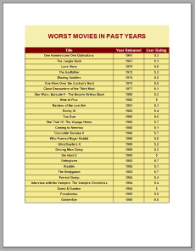
The resultant filter looks like the following.
=Fields!UserRating.Value < 6
To set filters on groups in a Data Region
You can also set filters on grouped data in a data region. The following example uses the Table data region to show filtering on groups.
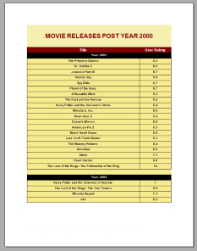
- In the report, set grouping on a data region. For example, on a Table data region, set grouping on the
=Fields!YearReleased.Valuefield. See Group in a Data Region for further details. - With the data region selected on the report, under the Properties window, click the Property dialog link. This is a command to open the corresponding data region dialog. See Properties Window for more on how to access commands.
Note: In a Classic Chart data region, right-click the data region and choose the Chart data option to open the Chart Data dialog. - In the Table dialog, go to the Groups tab and select the Group.
- After selecting the group, go to the Filters tab and click the Add (+) icon to add a new filter. By default, an empty filter expression gets added to the filter list.
- Under Expression, enter an expression or use the Expression Editor to provide the expression on which to filter data. For example,
=Fields!YearReleased.Value - Under Operator, select an operator from the list to decide how to compare the Expression with the Value. For example, GreaterThan operator set on the Expression above. See Filtering for a list of available operators and their description.
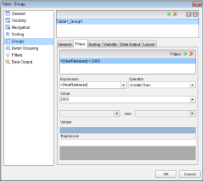
- Under Value, enter a value or set an expression using the Expression Editor with which to compare the expression results. For example, 2000 to represent the year 2000.
The resultant filter looks like the following.
=Fields!YearReleased.Value > 2000
See Also