The Chart control allows you to bind charts to any type of data source, including arrays. You can create a chart without setting its data source and load the data into the control at run time. This walkthrough illustrates how to create a simple unbound chart.
The walkthrough is split up into the following activities:
- Adding the chart control to the report and setting chart properties
- Adding code to create the chart at run time
Note: This walkthrough uses the Northwind database. By default, in ActiveReports, the Northwind.mdb file is located at [User Documents folder]\GrapeCity Samples\ActiveReports 12\Data\NWIND.mdb.
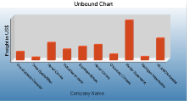
When you complete this walkthrough you get a layout that looks similar to the following at run time.
To add an ActiveReport to the Visual Studio project
- Create a new Visual Studio project.
- From the Project menu, select Add New Item.
- In the Add New Item dialog that appears, select ActiveReports 12 Section Report (code-based) and in the Name field, rename the file as UnboundChart.
- Click the Add button to open a new section report in the designer.
See Adding an ActiveReport to a Project for information on adding different report layouts.
To add the Chart control to the report
- From the toolbox, drag the Chart data region to the body of the report.
- If the chart wizard appears, click Cancel.
Tip: If you do not want the chart wizard to appear each time you add a chart, clear the Auto Run Wizard checkbox. You can still access the wizard via the command verbs (see below).
- In the Properties window, set the following properties.
Property Name Property Value Location 0, 0in Size 6.5, 3.5in - In the Report Explorer, select Detail and go to the properties window to set the Height property to 3.5.
- On the design surface, select the grey area outside the report and in the Properties window, set the PrintWidth property to 6.5.
To configure the appearance of the Chart
- Select the Chart control and at the bottom of the Properties window, select the Customize command. See Properties Window for further details on accessing commands.
Tip: If the verb is not visible, right-click an empty space in the Properties Window and select Commands to display verbs.
- In the ChartAreas view which displays by default, click the Axes bar to expand it.
- Click Axis X, and on the Common tab in the pane to the right, type Company Name in the Title textbox and set the font size to 12.
- Click Axis Y on the left, and on the Common tab in the pane to the right, type Freight in US$ in the Title textbox and increase the Font size to 12.
- Click the Titles bar on the left. In the list of titles, header is selected by default.
- On the Title properties page, type Unbound Chart in the Caption textbox and set the Font size to 14.
- Under Titles, select the footer and delete it by clicking the Delete icon on top of the list.
- Click the Series bar on the left.
- Under Series, select Series1, Series2 and Series3 and delete them by clicking the Delete icon on top of the list.
- Click the Legends bar on the left. The defaultLegend is selected by default.
- On the Common page, clear the Visible checkbox to hide the legend.
- Click the Finish button to exit the Chart Designer.
Back on the design surface of the report, the chart appears empty except for the title.
To add the code to create a chart at run time chart in Visual Basic or C#
Double-click the gray area below the report. This creates an event-handling method for rptUnboundChart's ReportStart event. Add code to the handler to:
- Create the series
- Create the dataset
- Set the chart properties
- Angle the labels to avoid overlap
The following examples show what the code for the methods look like in Visual Basic.NET and C#.
To write the code in Visual Basic.NET
| Visual Basic.NET code. Paste INSIDE the ReportStart event. |
Copy Code
|
|---|---|
'create the series
Dim series As New GrapeCity.ActiveReports.Chart.Series
series.Type = Chart.ChartType.Bar3D

'connection string and data adapter
Dim dbPath As String = "C:\Users\YourUserName\Documents\GrapeCity Samples\ActiveReports 12\Data\NWIND.MDB"
Dim connString As String = "Provider=Microsoft.Jet.OLEDB.4.0;Data Source= " + dbPath"
Dim da As New System.Data.OleDb.OleDbDataAdapter("SELECT * from Orders WHERE OrderDate < #08/17/1994#", connString)

'create the dataset
Dim ds As New DataSet
da.Fill(ds, "Orders")

'set chart properties
Me.ChartControl1.DataSource = ds
Me.ChartControl1.Series.Add(series)
Me.ChartControl1.Series(0).ValueMembersY = ds.Tables("Orders").Columns(7).ColumnName
Me.ChartControl1.Series(0).ValueMemberX = ds.Tables("Orders").Columns(8).ColumnName

'angle the labels to avoid overlapping
Me.ChartControl1.ChartAreas(0).Axes(0).LabelFont.Angle = 45
|
|
To write the code in C#
| C# code. Paste INSIDE the ReportStart event. |
Copy Code
|
|---|---|
//create the series
GrapeCity.ActiveReports.Chart.Series series = new GrapeCity.ActiveReports.Chart.Series();
series.Type = GrapeCity.ActiveReports.Chart.ChartType.Bar3D;

//connection string and data adapter
string dbPath = "C:\Users\YourUserName\Documents\GrapeCity Samples\ActiveReports 12\Data\NWIND.MDB";
string connString = "Provider=Microsoft.Jet.OLEDB.4.0;Data Source= " + dbPath;
System.Data.OleDb.OleDbDataAdapter da = new System.Data.OleDb.OleDbDataAdapter
("SELECT * from Orders WHERE OrderDate < #08/17/1994#", connString);

// create the dataset
System.Data.DataSet ds = new System.Data.DataSet();
da.Fill(ds, "Orders");

// set chart properties
this.chartControl1.DataSource = ds;
this.chartControl1.Series.Add(series);
this.chartControl1.Series[0].ValueMembersY = ds.Tables["Orders"].Columns[7].ColumnName;
this.chartControl1.Series[0].ValueMemberX = ds.Tables["Orders"].Columns[8].ColumnName;

// angle the labels to avoid overlapping
this.chartControl1.ChartAreas[0].Axes[0].LabelFont.Angle = 45;
|
|
To view the report
- Click the preview tab to view the report at design time.
OR
- Open the report in the Viewer. See Windows Forms Viewer for further information.
See Also