In ActiveReports, you can use the Chart data region to present data graphically in a report. The chart offers you 17 core chart types along with all of their variations, plus access to properties that control every aspect of your chart's appearance.
The Chart data region presents a series of points in different ways depending upon the chart type you choose. Some chart types display multiple series of data points in a single chart. Add more information to your chart by configuring data points, axes, titles, and labels. You can modify all of these elements in the Properties Window.
When you first drop a Chart data region onto a report, the Chart Wizard appears, and you can set up your chart type, appearance, series, titles, axes, and legend on the pages of the wizard. You can specify a data source on the Series page.
Important Properties
| Property | Description |
|---|---|
| BlackAndWhiteMode | Gets or sets a value indicating whether the chart is drawn in black and white using hatch patterns and line dashing to designate colors. |
| AutoRefresh | Gets or sets a value indicating whether the chart is automatically refreshed (redrawn) after every property change. |
| Backdrop | Gets or sets the chart's background style. |
| ChartAreas | Opens the ChartArea Collection Editor where you can set properties such as axes and wall ranges, and you can add more chart areas. |
| ChartBorder | Gets or sets the chart's border style. |
| ColorPalette | Gets or sets the chart's color palette. |
| DataSource | Gets or sets the data source for the chart. |
| GridLayout | Gets or sets the layout of the chart's areas in columns and rows. |
| Legends | Opens the Legend Collection Editor where you can set up the chart's legends. |
| Series | Opens the Series Collection Editor where you can set up the series collection for the chart. |
| Titles | Opens the Titles Collection Editor where you can set up titles in the header and footer of the chart. |
| UIOptions | Gets or sets user interface features for the chart. Choose from None, ContextCustomize, UseCustomTooltips, or ForceHitTesting. |
| Culture | Gets or sets the chart's culture used for value output formatting. |
| ImageType | Sets or returns the image generated by the chart. Choose from Metafile or PNG. |
Chart Commands and Dialogs
With the control selected on the report, in the Commands section at the bottom of the Properties window, you can click any of the commands to open a dialog. Commands in this section include:
- Clear Chart clears all of the property settings from the chart so that you can begin with a clean slate. You are given an opportunity to cancel this action.
- Load allows you to load a saved XML file containing a chart that you created using the Chart data region.
- Save As allows you to save the current chart to an XML file that you can load into a chart on any section report.
- Customize opens the main Chart Designer dialog where you can access Chart Areas, Titles, Series, Legends, and Appearance tabs. This dialog has access to more of the customizable areas than the wizard, but all of the properties in this dialog are also available in the Properties window.
- Wizard reopens the Chart Wizard that appears by default when you first drop a Chart data region onto a report.
- Data Source opens the Chart Data Source dialog where you can build a connection string and create a query.
Chart Elements
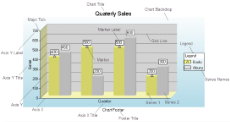
The Chart elements help you to easily analyze the visual information and interpret numerical and relational data. The following image illustrates the elements that make up the Chart data region.
Axis Label
A label along an axis that lets you label the units being shown.
Axis Title
The axis title allows you to provide a title for the information being shown on the axis.
Chart Backdrop
The chart backdrop is the background for the whole chart that is created. You can create your own backdrop using the different styles and colors available or you can use an image as a backdrop for your chart.
Chart Title
The chart title serves as the title for the chart.
Footer Title
The footer title allows you to add a secondary title for the chart along the bottom.
Grid Line
Grid lines can occur on horizontal and vertical axes and normally correlate to the major or minor tick marks for the axes.
Legend
The legend serves as a key to the specific colors or patterns being used to show series values in the chart.
Marker
The marker is used to annotate a specific plotted point in a data series.
Marker Label
The marker label allows you to display the value of a specific plotted point in a data series.
Major Tick
Major tick marks can occur on horizontal and vertical axes and normally correlate to the major gridlines for the axes.
Minor Tick
Minor tick marks can occur on horizontal and vertical axes and normally correlate to the minor gridlines for the axes.
Series
The series is a related group of data values that are plotted on the chart. Each plotted point is a data point that reflects the specific values charted. Most charts, such as the above bar chart, can contain more than one series, while others, such as a pie chart, can contain only one.
Wall Backdrop
The wall is the back section of the chart on which data is plotted.