The Chart control provides the means to change axis settings at design time or at run time. Chart axes make it possible to view and understand the data plotted in a graph.
Axis Types
Most 2D charts contain a numerical axis (AxisY) and a categorical axis (AxisX). 3D charts include another numerical axis (AxisZ). These axes are accessible at run time from the ChartArea object and allow you to control the settings for each, including scaling, labels, and various formatting properties. For any of the scaling or labeling properties you set to show up at run time, you will need to set the Visible property of the axis to True.
Changing Axis Settings
Axis settings can be changed at design time by clicking on a Chart control and using the Properties Window or at run time in code from the chart's ChartArea object.
ScalingFor normal linear scaling on a numeric axis, set the Max and Min properties for the axis, which correspond to the numerical values in the chart's data series. Also, set the Step property of the MajorTick to show the major numerical unit values. The Step property controls where labels and tick marks are shown on the numerical axis.
To write code in Visual Basic.NET
| Visual Basic code. Paste INSIDE the section Format event |
Copy Code
|
|---|---|
With Me.ChartControl1.ChartAreas(0).Axes("AxisY")
   .Max = 100
   .Min = 0
   .MajorTick.Step = 10
End With
|
|
To write code in C#
| C# code. Paste INSIDE the section Format event |
Copy Code
|
|---|---|
this.ChartControl1.ChartAreas[0].Axes["AxisY"].Max = 100; this.ChartControl1.ChartAreas[0].Axes["AxisY"].Min = 0; this.ChartControl1.ChartAreas[0].Axes["AxisY"].MajorTick.Step = 10; |
|
The Chart control also supports logarithmic scaling which allows you to show the vertical spacing between two points that corresponds to the percentage of change between those numbers. You can set your numeric axis to scale logarithmically by setting the IsLogarithmic property on the axis to True and setting the Max and Min properties of the axis.
Labeling
To show labels on an axis, you will need to specify the value for the LabelsGap property, set your LabelsFont properties, and set LabelsVisible to True. These properties can be set in the AxisBase Collection editor, which is accessed at design time by clicking the ellipsis button next to the ChartAreas (Collection) property, then the Axes (Collection) property of the ChartArea.
You can specify strings to be used for the labels instead of numerical values on an axis by using the Labels collection property at design time or assigning a string array to the Labels property at run time. You can also specify whether you want your axis labels to appear on the outside or inside of the axis line using the LabelsInside property. By default, labels appear outside the axis line.
Format for numeric value axis label
You can use the LabelFormat property to set the label format of numeric value axis. The LabelFormat property can be referenced from the AxisBase collection editor.
For example, if you want to display a digit separator as shown in the image above, you should specify "{0:c}" in the LabelFormat property to output the "\1,213" value. When "{0:#,###円}" is specified, the output value is "1,213円". The LabelFormat property uses the same format as the ListControl.DataFormatString property of .NET Framework standard control.
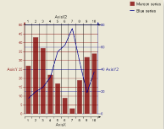
Secondary Axes
By default, a Chart object includes secondary X and Y axes (AxisX2 and AxisY2). At design time or run time, you can specify a secondary axis to plot data against by setting all of the appropriate properties for AxisX2 or AxisY2, including the Visible property.For example, if you want to use two axes to show the same data as it appears on two different scales, you can set the primary axis to show the actual data value scale, for example, and set the secondary axis to show a logarithmic scale.
To write code in Visual Basic.NET
| Visual Basic code. Paste INSIDE the section Format event |
Copy Code
|
|---|---|
' set properties for AxisY (primary axis)
With Me.ChartControl1.ChartAreas(0).Axes("AxisY")
   .Max = 25
   .Min = 0
   .MajorTick.Step = 5
End With

' set properties for AxisY2 (secondary Y axis)
With Me.ChartControl1.ChartAreas(0).Axes("AxisY2")
   .Max = 1000
   .Min = 0
   .MajorTick.Step = 200
' set the scaling for the secondary axis to logarithmic
   .AxisType = GrapeCity.ActiveReports.Chart.AxisType.Logarithmic
   .Visible = True
End With
|
|
To write code in C#
| C# code. Paste INSIDE the section Format event |
Copy Code
|
|---|---|
// set properties for AxisY (primary axis) this.ChartControl1.ChartAreas[0].Axes["AxisY"].Max = 25; this.ChartControl1.ChartAreas[0].Axes["AxisY"].Min = 0; this.ChartControl1.ChartAreas[0].Axes["AxisY"].MajorTick.Step = 5; // set properties for AxisY2 (secondary Y axis) this.ChartControl1.ChartAreas[0].Axes["AxisY2"].Max = 1000; this.ChartControl1.ChartAreas[0].Axes["AxisY2"].Min = 0; this.ChartControl1.ChartAreas[0].Axes["AxisY2"].MajorTick.Step = 200; // set the scaling for the secondary axis to logarithmic this.ChartControl1.ChartAreas[0].Axes["AxisY2"].AxisType = GrapeCity.ActiveReports.Chart.AxisType.Logarithmic; this.ChartControl1.ChartAreas[0].Axes["AxisY2"].Visible = true; |
|