In a Page Report you can create different layouts in a single report by designing your report on more than one page tab. This walkthrough describes the steps to create two different layouts and how data flows from the first layout to the next using the OverflowPlaceHolder control.
This walkthrough is split into the following activities:
- Adding an ActiveReport to a Visual Studio project
- Connecting to a the data source
- Adding a dataset
- Creating a layout for the first page
- Creating a layout for subsequent pages
- Viewing the Report
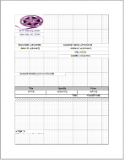
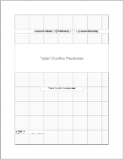
When you complete this walkthrough you get a layout that looks similar to the following at design time and at run time.
Design-Time Layout
| Page 1 | Page 2 |
|---|---|
|
|
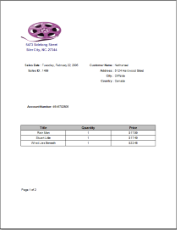
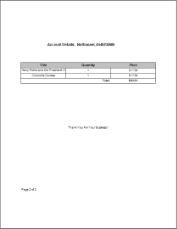
Notice that the run-time report layout below is similar to the one you see at design time except for the data which is added to the report at run time or when you preview it.
Run-Time Layout
| Page 1 | Page 2 |
|---|---|
|
|
To add an ActiveReport to the Visual Studio project
- Create a new Visual Studio project.
- From the Project menu, select Add New Item.
- In the Add New Item dialog that appears, select ActiveReports 12 Page Report and in the Name field, rename the file as rptMultipleLayout.
- Click the Add button to open a new fixed page report in the designer.
See Adding an ActiveReport to a Project for information on adding different report layouts.
To connect the report to a data source
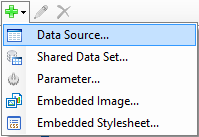
- In the Report Explorer, right-click the Data Sources node and select the Add Data Source option or select Data Source from the Add button.
- In the Report Data Source Dialog that appears, select the General page and in the Name field, enter a name like CustomerData.
- On this page, create a connection to the Reels database. See Connect to a Data Source for information on connecting to a data source.
To add a dataset
- In the Report Explorer, right-click the data source node and select the Add Data Set option or select Data Set from the Add button.
- In the DataSet Dialog that appears, select the General page and enter the name of the dataset as OrdersList. This name appears as a child node to the data source icon in the Report Explorer.
- On the Query page of this dialog, in the Query field enter the following SQL query.
SQL Query Copy CodeSelect * from customerorders - Click the Validate DataSet icon
 at the top right hand corner above the Query box to validate the query.
 - Click OK to close the dialog. Your data set and queried fields appear as nodes in the Report Explorer.
To create a layout for the first page
- Click the design surface to select the page, go to the properties window and set the FixedLayout - Grouping property to
=Fields!SalesID.Value.See Group in a FixedPage to understand grouping further. - In the Report Explorer, right-click the Embedded Images node to select Add Embedded Image.
OR
Alternatively, you can also select the Embedded Images option by clicking the Add (+) icon at the top on the Report Explorer.
This opens the Open dialog where you can select an image to embed in the report. - Drag and drop the embedded image, which now appears as a node in the Report Explorer, onto the Page 1 design surface and in the properties window set its Location property to 0in, 0in.
- From the Visual Studio toolbox, drag the following controls from the ActiveReports 12 Page Report tab, drop it onto the Page 1 design surface and set the following properties in the properties window.
Controls
Control Properties Textbox Color: DarkSlateBlue
Font: Normal, Arial, 11pt, Bold
Location: 0in, 1in
Size: 2in, 0.25in
TextAlign: Center
Value: 5473 Sidelong StreetTextbox Color: DarkSlateBlue
Font: Normal, Arial, 11pt, Bold
Location: 0in, 1.25in
Size: 2in, 0.25in
TextAlign: Center
Value: Siler City, NC. 27344Textbox Font: Normal, Arial, 10pt, SemiBold
Location: 0in, 2in
Size: 1in, 0.25in
TextAlign: Right
Value: Sales Date :Textbox Font: Normal, Arial, 10pt, SemiBold
Location: 0in, 2.25in
Size: 1in, 0.25in
TextAlign: Right
Value: Sales ID :Textbox Font: Normal, Arial, 10pt, SemiBold
Location: 3in, 2in
Size: 1.5in, 0.25in
TextAlign: Right
Value: Customer Name :Textbox Font: Normal, Arial, 10pt, SemiBold
Location: 3in, 2.25in
Size: 1.5in, 0.25in
TextAlign: Right
Value: Address :Textbox Font: Normal, Arial, 10pt, SemiBold
Location: 3in, 2.50in
Size: 1.5in, 0.25in
TextAlign: Right
Value: City :Textbox Font: Normal, Arial, 10pt, SemiBold
Location: 3in, 2.75in
Size: 1.5in, 0.25in
TextAlign: Right
Value: Country :Textbox Font: Normal, Arial, 10pt, SemiBold
Location: 0in, 4in
Size: 1.5in, 0.25in
TextAlign: Right
Value: Account Number:Table BorderStyle: Solid
FixedSize: 6.5in, 1in
Location: 0in, 5in
OverflowName: OverflowPlaceHolder1Note: Set this property after you add the OverflowPlaceHolder1 control to the design surface to handle the data that exceeds the fixed size of the Table data region.RepeatHeaderOnNewPage: True
Size: 6.5in, 0.75in - From the Report Explorer drag and drop the following fields onto the Page 1 design surface and set the following properties in the properties window.
Fields
Field Properties SaleDate Format: D
Location: 1in, 2in
Size: 2in, 0.25in
TextAlign: LeftSalesID Location: 1in, 2.25in
Size: 2in, 0.25in
TextAlign: LeftFirstName Location: 4.5in, 2in
Size: 2in, 0.25in
TextAlign: LeftAddress1 Location: 4.5in, 2.25in
Size: 2in, 0.25in
TextAlign: LeftCity Location: 4.5in, 2.5in
Size: 2in, 0.25in
TextAlign: LeftCountry Location: 4.5in, 2.75in
Size: 2in, 0.25in
TextAlign: LeftAccountNumber Location: 1.5in, 4in
Size: 2in, 0.25in
TextAlign: Left - Hover your mouse over the columns of the Table Details row to access the field selection adorner and set the following fields in the table cells along with their properties.
Cell Field Properties Left Cell Title BorderStyle: Solid
TextAlign: CenterMiddle Cell Quantity BorderStyle: Solid
TextAlign: CenterRight Cell Price BorderStyle: Solid
Format: c
TextAlign: CenterThis automatically places an expression in the details row and simultaneously places a static label in the header row of the same column.
- Select the Table Header row and set the following properties in the properties window.
Property Name Value BackgroundColor Silver Font Normal, Arial, 11pt, Bold RepeatOnNewPage True TextAlign Center - Set the properties of the following cells on the Table Footer row through the properties window.
Cell Properties Middle Cell Font: Normal, Arial, 10pt, Bold
TextAlign: Right
Value: Total:Right Cell Font: Normal, Arial, 10pt, Bold
Format: c
TextAlign: Center
Value:=Sum(Fields!Price.Value) - In the Report Explorer, expand the Common Values node and drag and drop the Page N of M (Section) field onto the Page 1 design surface and set its Location property to 0in, 8in in the properties window.
To create a layout for subsequent Pages
- Click the New tab to add a new page to the report layout. This page is named Page 2 by default.
- From the Visual Studio toolbox, drag the following controls from the ActiveReports 12 Page Report tab, drop it onto the Page 2 design surface and set the properties in the properties window.
Controls
Control Properties Textbox Font: Normal, Arial, 12pt, Bold
Location: 0in, 1in
Size: 2.625in, 0.25in
TextAlign: Right
Value: Account Details:Textbox Font: Normal, Arial, 12pt, Bold
Location: 2.625in, 1in
Size: 3.25in, 0.25in
Value:=Fields!FirstName.Value + ", " + Fields!AccountNumber.ValueOverflowPlaceHolder Location: 0in, 2in
Size: 6.5in, 2inTextbox Location: 1.75in, 5in
Size: 3in, 0.25in
TextAlign: Center
Value: Thank You For Your Business! - In the Report Explorer, expand the Common Values node and drag and drop the Page N of M (Section) field onto the Page 2 design surface and set its Location property to 0in, 8in in the properties window.
To view the report
- Click the preview tab to view the report.
OR
- See Windows Forms Viewer to display report in the Viewer at run time.