Tablix data region can be used to display complex data using row groups and column groups. Let us look at a few scenarios to understand how Tablix data region works.
Using Multiple Adjacent Groups
In Tablix data region, unlike Matrix and Table data regions, it is possible to create multiple adjacent groups. Let us take an example of a Sales report to understand how grouping works in a Tablix data region.
Scenario
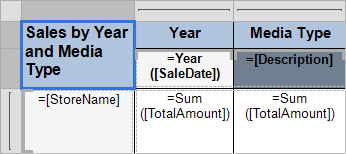
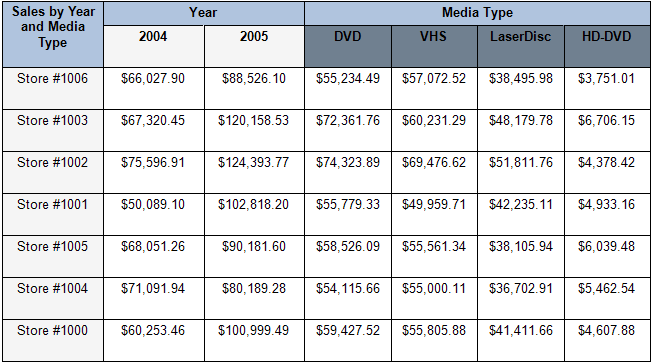
An organization wants to create a Sales report that displays sales data by year and media type. To design such a report using Tablix data region, you need to create multiple adjacent groups in column group area, a single group in row group area, and display aggregated data in the body area.
Let us see how each area of Tablix data region works to create the desired output given below.
Column group area
The column group area contains two adjacent groups, namely Year and Media Type. The Year group displays the grouped data according to the year 2004 and 2005 and the Media Type group displays the grouped data values according to DVD, VHS, LaserDisc, HD-DVD media types stored in the database.
Row group area
The row group area contains a single group that is StoreName. Cells in the row group area display row group values and represent members of the row group hierarchy.
Body area
This area displays the aggregate sum of the TotalAmount in the Tablix. Cells in the tablix body area display detail data when the cells are in detail row or column and aggregated group data when the cell are in a group row or column.
Refer to Grouping in Tablix Walkthrough for detailed steps on how to create the above report using Tablix data region.
Using Cell Merging
In Tablix data region, it is possible to merge cells having duplicate values. Let us take an example of a Store Mangers report to understand how cell merging works in a Tablix data region.
Scenario
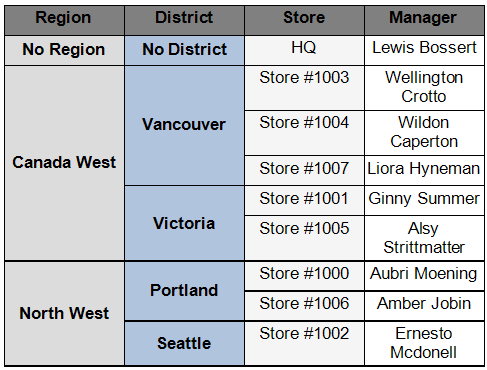
An organization wants to create a report to display names of all the store managers, using the concept of cell merging where cells with same value are merged automatically to avoid clutter.
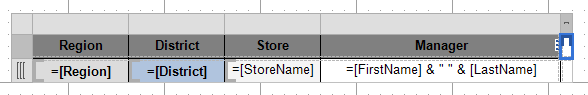
To design such a report, you need to create nested groups in Tablix data region to display the name of managers according to the Region, District and StoreName.
Let us see how each area of Tablix data region works to create the desired output given below.
Column group area
The column group area contains no groups, however there are static labels for each column. There are four column labels, namely Region, District, Store, and Manager that are added as headers to describe information about the data.
Row group area
The row group area contains three groups that are nested in a parent/child relationship to display the row group data. The Region (parent) and District group (child) values are merged automatically to remove duplicate data values.
Body area
This area displays the full name of store managers. The body area displays the managers full name by concatenating two fields FirstName and LastName using the & operator in the expression.
Refer to Cell Merging in Tablix Walkthrough for detailed steps on how to create the above report using Tablix data region.
See Also