This walkthrough illustrates a step-by-step implementation for creating a report which uses the Tablix data region to display regional product sales.
The walkthrough is split into the following activities:
- Creating an ActiveReports project in Visual Studio
- Connecting the report to a data source
- Adding a dataset
- Creating a layout for the report
- Enhancing the appearance of the report
- Viewing the report
- This walkthrough uses the Reels database. By default, in ActiveReports, the Reels.mdb file is located in the [User Documents folder]\GrapeCity Samples\ActiveReports 12\Data folder.
- Although this walkthrough uses RDL reports, you can also implement this using page reports.
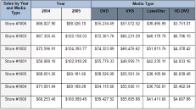
When you complete this walkthrough, you will have a layout that looks similar to the following at design time and at run time.
Design-Time Layout
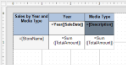
Run-TimeLayout
Creating an ActiveReports project in Visual Studio
- Create a new Visual Studio project.
- In the New Project dialog that appears, select ActiveReports 12 RDL Report Application and in the Name field, name the file rptTablix.
- Click OK to create a new ActiveReports 12 RDL Report Application. By default an RDL report is added to the project.
See Adding an ActiveReport to a Project for information on adding different report layouts.
Connecting the report to a data source
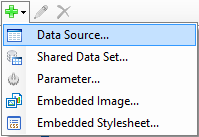
- In the Report Explorer, right-click the Data Sources node and select the Add Data Source option or select Data Source from the Add button.
- In the Report Data Source Dialog that appears, select the General page and in the Name field, enter a name like ReportData.
- On this page, create a connection to the Reels database. See Connect to a Data Source for information on connecting to a data source.
Adding a dataset
- In the Report Explorer, right-click the ReportData node (the name of data source added) and select the Add Data Set option or select Data Set from the Add button.
- In the DataSet Dialog that appears, select the General page and name the dataset SalesData. This name appears as a child node of the data source icon in the Report Explorer.
- On the Query page of this dialog, in the Query field enter the following SQL query.
SQL Query Copy CodeSELECT Sale.SaleDate, Sale.TotalAmount, MediaType.Description, MediaType.MediaID, Sale.SalesID, Sale.Store, Store.StoreName FROM Store INNER JOIN (Sale INNER JOIN (MediaType INNER JOIN (MovieProduct INNER JOIN SaleDetails ON MovieProduct.ProductID = SaleDetails.ProductID) ON MediaType.MediaID = MovieProduct.MediaType) ON Sale.SalesID = SaleDetails.SaleID) ON Store.StoreID = Sale.Store;
- Click the Validate DataSet icon
 at the top right hand corner above the Query box to validate the query.
 - Click OK to close the dialog. Your data set and queried fields appear as nodes in the Report Explorer.
Creating a layout for the report
- From the toolbox, drag a Tablix data region onto the designer surface of the report.
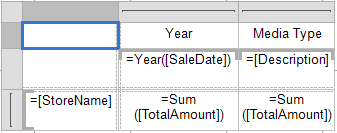
- Hover over TextBox2 to reveal the field selection adorner, click it to display a list of available fields, and select the SaleDate field. This is a column group cell, so selecting a field in it automatically adds a column group.
- With TextBox2 selected, in the Properties window set the Value to =Year(Fields!SaleDate.Value) using expressions. This groups and displays the data by Year.
- In the Group Editor, select the SaleDate group, and in the Properties window expand the Group property node and click the ellipsis button next to the GroupExpressions property to open the Expressions dialog.
- In the Expressions dialog that appears, select the group member from the Members list and in the property grid to the right, enter the expression =Year(Fields!SaleDate.Value) to group the data by year and then click OK to close the dialog.
- Right-click TextBox2 where SaleDate field is added in the Tablix data region, select Add Column Group, and then select the Adjacent Right option. The adjacent column group is added to the right and is listed under the Group Editor window.
- Hover over TextBox5 to reveal the field selection adorner, click it to display a list of available fields, and select the Description field. This is a column group cell, so selecting a field in it automatically adds a column group.
- Right-click TextBox5 where Description field is added in the Tablix data region, select Insert Row, and then select Outside Group - Above. The row is added above the new column group and is listed under the Group Editor window.
- In TextBox7 and TextBox8 above the SaleDate and Description fields, set the Value property to Year and Media Type, respectively.
- Hover over TextBox3 to reveal the field selection adorner, click it to display a list of available fields, and select the StoreName field. This is a row group cell, and selecting a field in it automatically adds a row group.
- Hover over TextBox4 to reveal the field selection adorner, click it to display the list of available fields, and select the TotalAmount field.
- Hover over TextBox6 to reveal the field selection adorner, click it to display the list of available fields, and select the TotalAmount field.
Enhancing the appearance of the report
When you preview the report at this point, you will notice the data from the fields is displayed in the Tablix data region. We can enhance the layout of the Tablix data region by setting cell properties in the Properties Window as follows:
-
Cell Property Name Property Value =Year([SaleDate]) BackgroundColor WhiteSmoke BorderStyle Solid FontWeight Bold TextAlign Center Year BackgroundColor LightSteelBlue BorderStyle Solid FontWeight Bold TextAlign Center =[Description] BackgroundColor SlateGray BorderStyle Solid FontWeight Bold TextAlign Center Media Type BackgroundColor LightSteelBlue BorderStyle Solid FontWeight Bold TextAlign Center =[StoreName] BackgroundColor WhiteSmoke BorderStyle Solid TextAlign Center =Sum([TotalAmount]) Format c BorderStyle Solid TextAlign Center - Select the two empty cells in the corner area (top left corner), right-click the selected area, and then select Merge Cells option to merge the cells.
- With the merged cell selected, in the Properties window set the Value property to Sales by Year and Media Type . This is the heading for the report.
- In the Tablix data region, select the textbox that contains Sales by Year and Media Type text and then go to Properties Window to set the following properties.
Property Name Property Value BackgroundColor LightSteelBlue BorderStyle Solid FontWeight Bold TextAlign Center - Select the Tablix data region and go to the Properties window to set the following properties.
Property Name Property Value Location 0in, 0in Size 3in, 1.125in
Viewing the report
- Click the preview tab to view the report at design time.
OR
- Open the report in the Viewer. See Windows Forms Viewer for further information.