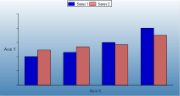
A chart series is the key to showing data in a chart. All data is plotted in a chart as a series and all charts contain at least one series. The bars in the image below depict two series in a simple bar chart.
Each series is made up of a set of data points consisting of an X value that determines where on the X axis the data is plotted, and one or more Y values. Most charts use one Y value but a few charts such as the Bubble, BubbleXY, and the financial charts take multiple Y values.
When you bind data to a series, the X value is bound using the ValueMembersX property on the Series object, and the Y value is bound using the ValueMembersY property.
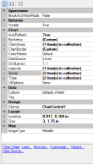
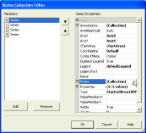
The Series object also contains properties for each individual series, including chart type, custom chart properties, annotations, containing chart area, and more. Each chart type in the ActiveReports Chart control contains series-specific properties that apply to it. You can set the chart type and these series-specific properties in the Series Collection Editor dialog, which opens when you click the ellipsis button next to the Series (Collection) property in the Visual Studio Properties window.
You can manipulate each data point in the DataPoint Collection dialog box. You can access the dialog from the Series Collection Editor by clicking the ellipsis button next to the Points (Collection) property.
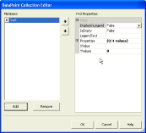
When you set a property on the Series object, it is applied to all data point objects in the series unless a different value for the property is set on a specific data point. In that case, the data point property setting overrides the series property setting for that particular data point. Note that for charts bound to a data source, you do not have access to the DataPoint collection in the dialog.
If you specify the value for any of the custom properties, this value is not cleared when you change the ChartType. Although this will show properties that do not apply to certain ChartTypes, it has the advantage of keeping your settings in case you accidentally change the ChartType.
Setting chart and series-specific properties at run time
To set custom properties for a chart on the series programmatically, reference the series by name or index and use the string Properties attribute name you wish to set.
The following code samples set the shape for bubbles on a bubble chart to diamond.
To write code in Visual Basic.Net
Visual Basic.NET code. Paste INSIDE the section Format event. |
Copy Code
|
|---|---|
Me.ChartControl1.Series(0).Properties("Shape") = Chart.MarkerStyle.Diamond
|
|
To write the code in C#
| C# code. Paste INSIDE the section Format event. |
Copy Code
|
|---|---|
this.chartControl1.Series[0].Properties["Shape"] = GrapeCity.ActiveReports.Chart.MarkerStyle.Diamond; |
|
To set custom properties for a chart on the data points object programmatically, reference the series by name or index, reference the data point by index, and use the string Properties attribute name you wish to set.
The following code samples set the explode factor on a doughnut chart for the second point in the series.
To write code in Visual Basic.Net
| Visual Basic.NET code. Paste INSIDE the section Format event. |
Copy Code
|
|---|---|
Me.ChartControl1.Series(0).Points(1).Properties("ExplodeFactor") = 0.5F
|
|
To write the code in C#
| C# code. Paste INSIDE the section Format event. |
Copy Code
|
|---|---|
this.chartControl1.Series[0].Points[1].Properties["ExplodeFactor"] = .5f; |
|
See Also