Wijmo UI for the Web
chart_indicator Interface
wijmo.chart Namespace : chart_indicator Interface

Sets up an object that can display an indicator line running horizontally through the center of each bar or bubble in the chart when the user clicks it. When the indicator line appears, it pushes the hint to the top edge of the chart.

Type: object

Default: indicator: {visible:false, style:{stroke:"#000000"}

Example

This code sets the visible attribute of the indicator option to true, and sets the color to purple, as in the image below.

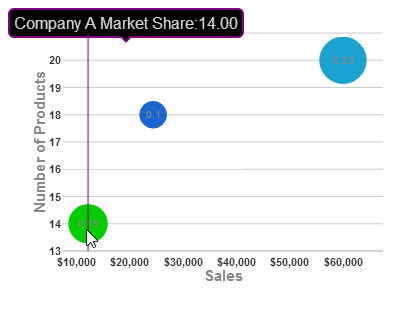
<script type="text/javascript">
$(document).ready(function () {
    $("#wijbubblechart").wijbubblechart({
        axis: {
            y: {text: "Number of Products"},
            x: {text: "Sales", annoFormatString: "C0"}
        },
        indicator: {visible: true, style: {stroke: "purple"}},
        legend: {visible: false},
        seriesList: [
        {
            label: "Company A Market Share",
            data: { y: [14], x: [12200], y1: [.15] }
        }, {
            label: "Company B Market Share",
            data: { y: [20], x: [60000], y1: [.23] }
        }, {
            label: "Company C Market Share",
            data: { y: [18], x: [24400], y1: [.1] }
        }]
    });
});
</script>
Fields
 NameDescription
 Field
A value that contains the fill color and outline color (stroke) of the indicator lines.
Type: Object
Default: {stroke: "#000000"}
 
 Field

A value that indicates whether to show indicator lines when the user clicks a chart element in the chart.

 
Top
See Also

Reference

wijmo.chart Namespace