var instance; // Type: wijmo.chart.chart_axis;
var value; // Type: chart_axis_grid
value = instance.gridMinor;
var gridMinor : chart_axis_grid;
var instance; // Type: wijmo.chart.chart_axis; var value; // Type: chart_axis_grid value = instance.gridMinor;
var gridMinor : chart_axis_grid;
This code creates a chart with both gridMajor and gridMinor lines made visible for the X axis. Since the default style settings are the same for both, in addition to setting the visible attribute to true for both, we set the style property for the gridMajor option to show a solid line. So the major grid lines in the resulting chart are solid lines, while the minor grid lines are dashed, as in the image below.
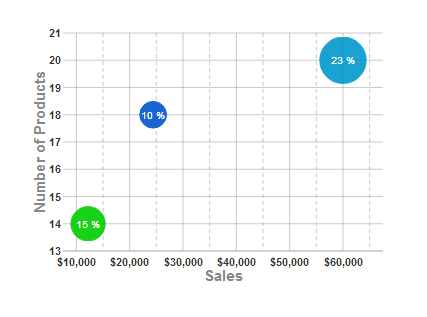
<script type="text/javascript">
$(document).ready(function () {
    $("#wijbubblechart").wijbubblechart({
        axis: {
            y: {text: "Number of Products"},
            x: {
                text: "Sales",
                annoFormatString: "C0",
                gridMajor: {visible: true, style: {"stroke-dasharray": ""}},
                gridMinor: {visible: true}
                }
        },
        chartLabelFormatString: "p0",
        chartLabelStyle: {fill: "white"},
        legend: {visible: false},
        seriesList: [
        {
            label: "Company A Market Share",
            data: { y: [14], x: [12200], y1: [.15] }
        }, {
            label: "Company B Market Share",
            data: { y: [20], x: [60000], y1: [.23] }
        }, {
            label: "Company C Market Share",
            data: { y: [18], x: [24400], y1: [.1] }
        }]
    });
});
</script>