Wijmo UI for the Web
Show Tick Marks
Wijmo User Guide > Widgets > Chart Widgets > CompositeChart > CompositeChart How To > Show Tick Marks

Building on the Quick Start example, you can add tickMajor and tickMinor objects, which contain styles for the axis tick marks.

  1. In the <head> section of your HTML file, replace the script that includes the document ready function with this one, which initializes the widget and sets several widget options.
    • Sets the following options on the X axis:
      • Tick marks for each major value in the chart (tickMajor) cross the X axis line, and are blue.
      • Tick marks for each minor value in the chart (tickMinor) sit inside the X axis line, and are lime green. 
        Note: The position attribute of the tick determines whether to show it.
    • Creates two data series with the following properties:
      • The Y axis displays the increase in sales for each maker using columns.
      • The X axis displays the name of each auto maker.
      • A pie chart displays the import versus domestic increases.

    Drop down and copy code

    Show Grid Lines Script
    Copy Code
    <script id="scriptInit" type="text/javascript">
      $(document).ready(function () {
        $("#wijcompositechart").wijcompositechart({
            axis: {
                x: {
                    tickMajor: {position: "cross", style: {stroke: "blue"}},
                    tickMinor: {position: "inside", style: {stroke: "limegreen"}}
                }
            },
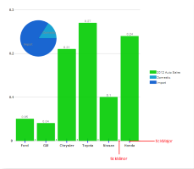
            data: {x: ['Ford', 'GM', 'Chrysler', 'Toyota', 'Nissan', 'Honda']},
            seriesList: [
            {
                type: "column",
                label: "2012 Auto Sales",
                data: { y: [.05, .04, .21, .27, .1, .24] }
            },
            {
                type: "pie",
                center: { x: 120, y: 120 },
                radius: 60,
                data: [{label: "Domestic", data: 5.7}, {label: "Import", data: 30}]
            }]
        });
      });
    </script>
    
  2. No changes are necessary in the <body> section of your HTML file. The basic <div> tag is sufficient to create the chart.
  3. Save your HTML file and open it in a browser. The chart appears like the one in the image below, with blue major tick marks that cross the X axis, and limegreen minor tick marks inside it.
    Tick Marks

    Tick Marks

See Also

Widgets

Reference