Wijmo UI for the Web
Data Binding
The LineChart widget offers options that provide data binding support for anything from a simple line chart to a complex grouped line chart.
The following examples show you how to bind a single series chart to an array, how to bind a multiple series chart to different data members, and bind a multiple series chart to a shared x member and multiple y members.
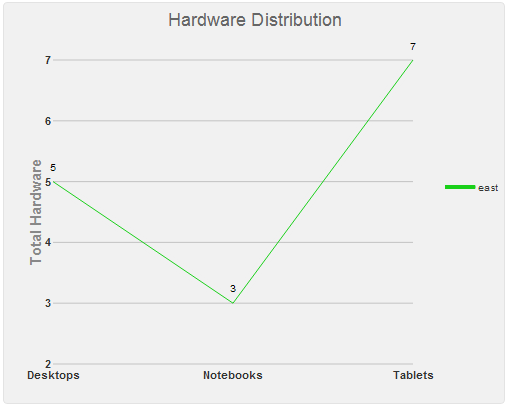
For single series charts, create an array, set the dataSource option to the array, and in the seriesList option, bind the x and y data to a member in your array.
Script to bind a single series to a data source
| Data Binding Script |
Copy Code |
|---|---|
//Create Data
var data = [
    {Device: 'Desktops', Count: 5},
    {Device: 'Notebooks', Count: 3},
    {Device: 'Tablets', Count: 7}
];

$("#wijlinechart").wijlinechart({
    dataSource: data,
    seriesList: [{
        legendEntry: true,
        data: { x: {bind: "Device"}, y: {bind: "Count"}}
    }]
});
| |
This code yields a line chart like that in the image below.
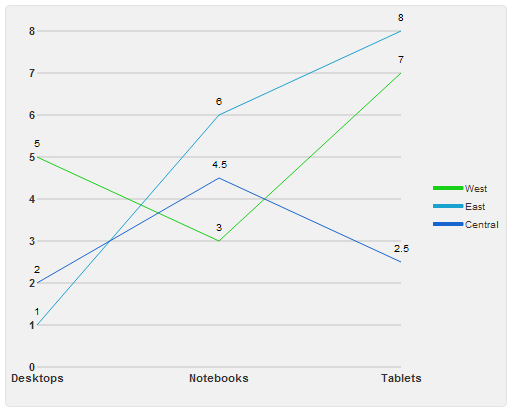
For charts with multiple series, if you use a single data array, you can set the dataSource option on the chart to apply to all of the series. However, if you want to use a different array for each series, you can define the dataSource option for each series in the seriesList with script like the following.
Script to bind mutiple series to different data sources
| Data Binding Script |
Copy Code |
|---|---|
//create data
var dataWest = [
        {Device: 'Desktops', Count: 5},
        {Device: 'Notebooks', Count: 3},
        {Device: 'Tablets', Count: 7}
    ],
    dataEast = [
        {Device: 'Desktops', Count: 1},
        {Device: 'Notebooks', Count: 6},
        {Device: 'Tablets', Count: 8}
    ],
    dataCentral = [
        {Device: 'Desktops', Count: 2},
        {Device: 'Notebooks', Count: 4.5},
        {Device: 'Tablets', Count: 2.5}
    ];

$("#wijlinechart").wijlinechart({
    seriesList: [{
            dataSource: dataWest,
            label: "West",
            legendEntry: true,
            data: { x: { bind: "Device" }, y: { bind: "Count"} }
        }, {
            dataSource: dataEast,
            label: "East",
            legendEntry: true,
            data: { x: { bind: "Device" }, y: { bind: "Count"} }
        }, {
            dataSource: dataCentral,
            label: "Central",
            legendEntry: true,
            data: { x: { bind: "Device" }, y: { bind: "Count"} }
        }]
});
| |
This code yields a line chart like that in the image below.
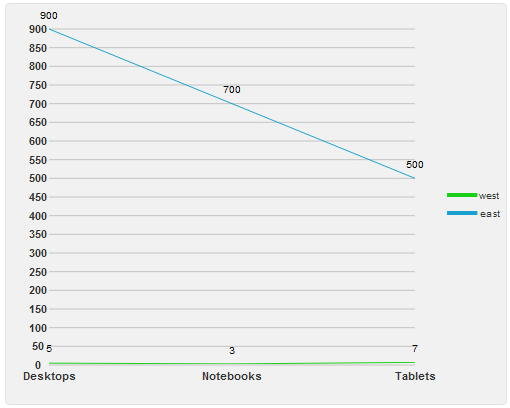
For multiple series charts that have a common x member and different y members, set the dataSource for the chart, then bind x on the chart's data option, and bind the y values in each series in the seriesList.
Script to bind to a shared data source
| Data Binding Script |
Copy Code |
|---|---|
//Create Data
var data = [
    {Device: 'Desktops', Count: 5, Price: 900},
    {Device: 'Notebooks', Count: 3, Price: 700},
    {Device: 'Tablets', Count: 7, Price: 500}
];

$("#wijlinechart").wijlinechart({
    dataSource: data,
    data: { x: { bind: "Device"} },
    seriesList: [{
        label: "west",
        legendEntry: true,
        data: { y: { bind: "Count"} }
    }, {
        label: "east",
        legendEntry: true,
        data: { y: { bind: "Price"} }
    }]
});
| |
This code yields a line chart like that in the image below.