Wijmo UI for the Web
Knockout Pie Chart
1. Add Library References
The first step is to create an .html page and add links to the dependencies to your project within the <head> tags. To do this, link to the content delivery network (CDN) files:
Note: Please reference the latest dependencies from the CDN at http://www.wijmo.com/downloads/cdn.
| References |
Copy Code |
|---|---|
<!--jQuery References--> <script src="http://code.jquery.com/jquery-1.11.1.min.js" type="text/javascript"></script> <script src="http://code.jquery.com/ui/1.11.0/jquery-ui.min.js" type="text/javascript"></script> <!--Theme--> <link href="http://cdn.wijmo.com/themes/aristo/jquery-wijmo.css" rel="stylesheet" type="text/css" /> <!--Wijmo Widgets CSS--> <link href="http://cdn.wijmo.com/jquery.wijmo-pro.all.3.20161.90.min.css" rel="stylesheet" type="text/css" /> <!--Wijmo Widgets JavaScript--> <script src="http://cdn.wijmo.com/jquery.wijmo-open.all.3.20161.90.min.js" type="text/javascript"></script> <script src="http://cdn.wijmo.com/jquery.wijmo-pro.all.3.20161.90.min.js" type="text/javascript"></script> | |
Then add a reference to Knockout 2.0 and the Knockout extension library for Wijmo within the <head> tags:
<!--Knockout JS library-->
<script src="http://cdn.wijmo.com/external/knockout-2.0.0.js" type="text/javascript"></script>

<!--Wijmo Knockout Integration Library-->
<script src="http://cdn.wijmo.com/external/knockout.wijmo.js" type="text/javascript"></script>
2. Create the ViewModel and View
Now create a view model to define the data and behavior of the UI. Enter the following <script> within the <head> tags:
| Create ViewModel Script |
Copy Code |
|---|---|
<script type="text/javascript"> //Create ViewModel--> var viewModel = function () { var self = this; self.males = ko.numericObservable(10); self.females = ko.numericObservable(90); }; </script> | |
To create the wijpiechart HTML element, place the following markup within the body of the .html document. This serves as the View in the MVVM pattern.
| View Markup |
Copy Code |
|---|---|
<!--Create View--> <div> males: <input type="text" data-bind="value: males" /> females: <input type="text" data-bind="value: females" /> </div> <div class="piechart" data-bind="wijpiechart: { width: 600, height: 400, seriesList: [ {label: 'Male', data: males}, {label: 'Female', data: females} ]}"> </div> | |
3. Bind Wijmo Widgets to the ViewModel and Activate KO
Now bind to the ViewModel and activate knockout.js by adding the following JavaScript within the <script> tags after the ViewModel script:
| Bind ViewModel |
Copy Code |
|---|---|
<!--Bind ViewModel-->
         $(document).ready(function () {
             var vm = new viewModel();
             ko.applyBindings(vm);
}); | |
Here is the full wijpiechart sample markup.
| Full Markup |
Copy Code |
|---|---|
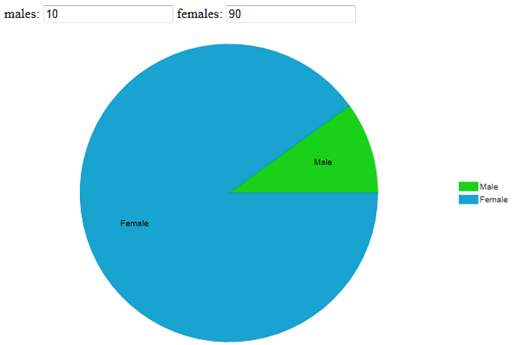
<!DOCTYPE html PUBLIC "-//W3C//DTD XHTML 1.0 Transitional//EN" "http://www.w3.org/TR/xhtml1/DTD/xhtml1-transitional.dtd"> <html xmlns="http://www.w3.org/1999/xhtml"> <head> <title></title> <script src="../../external/jquery-1.7.1.min.js" type="text/javascript"></script> <script src="../../external/jquery-ui-1.8.18.custom.min.js" type="text/javascript"></script> <script src="../../external/globalize.min.js" type="text/javascript"></script> <script src="../../wijmo/jquery.wijmo.wijchartcore.js" type="text/javascript"></script> <script src="../../wijmo/jquery.wijmo.wijpiechart.js" type="text/javascript"></script> <script src="../../wijmo/jquery.wijmo.wijutil.js" type="text/javascript"></script> <script src="../../wijmo/jquery.wijmo.wijslider.js" type="text/javascript"></script> <script src="../../external/knockout-2.0.0.js" type="text/javascript"></script> <script src="../../../../Wijmo-Open/development-bundle/wijmo/knockout.wijmo.js" type="text/javascript"></script> <script type="text/javascript"> <!--Create ViewModel--> var viewModel = function () { var self = this; self.males = ko.numericObservable(10); self.females = ko.numericObservable(90); }; <!--Bind ViewModel--> $(document).ready(function () { var vm = new viewModel(); ko.applyBindings(vm); }); </script> </head> <body> <!--Create View--> <div> males: <input type="text" data-bind="value: males" /> females: <input type="text" data-bind="value: females" /> </div> <div class="piechart" data-bind="wijpiechart: { width: 600, height: 400, seriesList: [ {label: 'Male', data: males}, {label: 'Female', data: females} ]}"> </div> </body> </html> | |
When you open the page, the wijpiechart looks similar to the image above. Enter new values for the males and females, and the pie updates accordingly.