Wijmo UI for the Web
Change Markers
Wijmo User Guide > Widgets > Chart Widgets > ScatterChart > ScatterChart How To > Change Markers

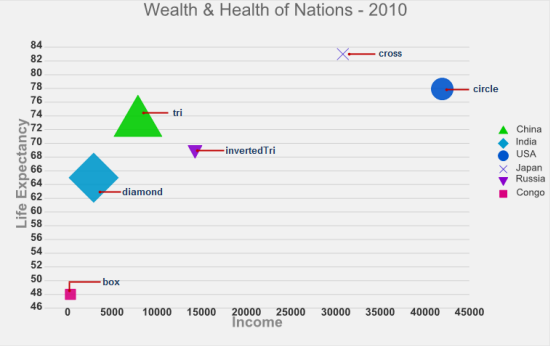
Building on the Quick Start example, you can change the markers and the marker colors using the seriesList and seriesStyles options.

  1. In the <head> section of your HTML file, replace the script that includes the document ready function with this one, which changes the seriesList markerType and uses the seriesStyles option to change the fill and outline color of the markers. 

    Drop down and copy script to paste in <head> section

    Script
    Copy Code
    <script id="scriptInit" type="text/javascript">
        $(document).ready(function () {
            $("#wijscatterchartDefault").wijscatterchart({
                header: {text: "Height Versus Weight of 72 Individuals by Gender"},
                axis: {
                    y: {
                        text: "Weight (kg)",
                        labels: {
                            style: {fill: "#7f7f7f", "font-size": "11pt"}
                        },
                        gridMajor: {
                            style: { stroke: "#353539", "stroke-dasharray": "- " }
                        },
                        tickMajor: { position: "outside", style: { stroke: "#7f7f7f"} },
                        tickMinor: { position: "outside", style: { stroke: "#7f7f7f"}}
                    },
                    x: {
                        text: "Height (cm)",
                        labels: {
                            style: {fill: "#7f7f7f", "font-size": "11pt", rotation: -45}
                        },
                        tickMajor: { position: "outside", style: { stroke: "#7f7f7f"}}
                    }
                },
                hint: {
                    content: function () {
                        return this.x + ' cm, ' + this.y + ' kg'
                    },
                    contentStyle: {"font-size": "10pt"},
                    offsetY: -10
                },
                seriesList: [
                    {
                        label: "Female",
                        data: {
                            x: [161.4, 169.0, 166.2, 159.4, 162.5, 159.0, 162.8, 159.0, 179.8, 162.9, 161.0, 151.1, 
                                168.2, 168.9, 173.2, 174.0, 162.6, 174.0, 162.6, 161.3, 156.2, 149.9, 169.5, 160.0, 175.3, 
                                169.5, 160.0, 172.7, 162.6, 157.5, 176.5, 164.4, 160.7, 174.0, 163.8],
                            y: [63.4, 58.2, 58.6, 45.7, 52.2, 48.6, 57.8, 55.6, 66.8, 59.4, 53.6, 73.2, 53.4, 69.0, 
                                58.4, 73.6, 61.4, 55.5, 63.6, 60.9, 60.0, 46.8, 57.3, 64.1, 63.6, 67.3, 75.5, 68.2, 61.4, 
                                76.8, 71.8, 55.5, 48.6, 66.4, 67.3]
                        },
                        markerType: "cross"
                    }, {
                        label: "Male",
                        data: {
                            x: [175.0, 174.0, 165.1, 177.0, 192.0, 176.5, 169.4, 182.1, 179.8, 175.3, 184.9, 177.3, 
                                167.4, 178.1, 168.9, 174.0, 167.6, 170.2, 167.6, 188.0, 174.0, 176.5, 180.3, 167.6, 188.0, 
                                180.3, 167.6, 183.0, 183.0, 179.1, 170.2, 177.8, 179.1, 190.5, 177.8, 180.3, 180.3],
                            y: [70.2, 73.4, 70.5, 68.9, 102.3, 68.4, 65.9, 75.7, 84.5, 87.7, 86.4, 73.2, 53.9, 72.0, 55.5, 
                                70.9, 64.5, 77.3, 72.3, 87.3, 80.0, 82.3, 73.6, 74.1, 85.9, 73.2, 76.3, 65.9, 90.9, 89.1, 
                                62.3, 82.7, 79.1, 98.2, 84.1, 83.2, 83.2]
                        },
                        markerType: "circle"
                    }
                ],
                seriesStyles: [
                    {fill: "deeppink", stroke: "deeppink"}, 
                    {fill: "cornflowerblue", stroke: "cornflowerblue"}
                ]
            });
        });  
    </script>
  2. No changes are necessary in the <body> section of your HTML file. The basic <div> tag is sufficient to create the chart.
  3. Save your HTML file and open it in a browser. The widget appears like the one in the live widget below, with pink and blue cross and circle markers.
Note: You can set each series of data in the seriesList option to use a different marker type. The available marker types are box, circle, cross, diamond, invertedTri, and tri. A BubbleChart illustrates the available markers in the image below.

See Also

Reference

Widgets