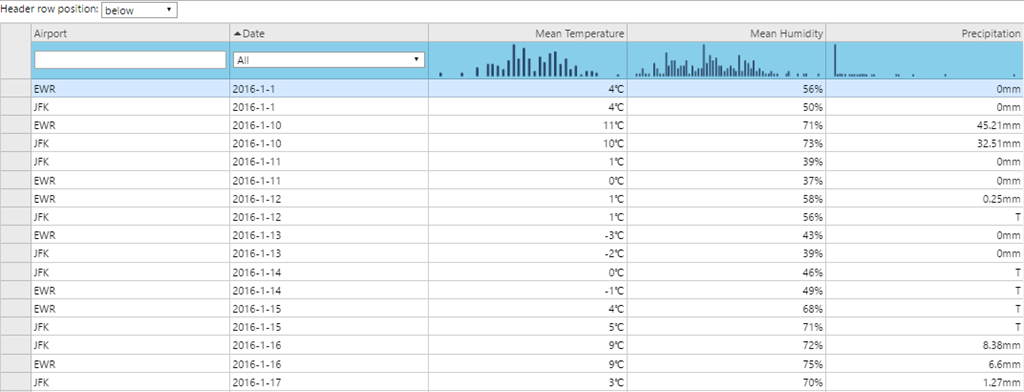
Spread.Views provides you with the ability to set header rows at the top of the grid. You can use the header row to sort data, show summary charts, and so on.
Use the following steps to set a header row in a grid.

Sample Code
- Add a reference to sparkline.min.js to use sparklines in the column header.
<script src="[Your Script Path]/gc.spread.views.sparkline.10.1.1.min.js" type="text/JavaScript"></script> <script src="data/airport.js" type="text/javascript"></script> - Add the column definition along with the column header definition.
var columns = [{ id: 'airport', caption: 'Airport', dataField: 'airport', minWidth: 150, headerRow: { renderer: '<div class="header-input"><input type="text"/></div>' } }, { id: 'date', caption: 'Date', dataField: 'EST', minWidth: 150, headerRow: { renderer: '<div class="header-input"><select><option value="all">All</option><option value="January">January</option><option value="February">February</option><option value="March">March</option></select></div>' } }, { id: 'meanTemperature', caption: 'Mean Temperature', dataField: 'Mean_TemperatureC', minWidth: 150, presenter: '<span>{{=it.meanTemperature}}℃</span>', headerRow: { renderer: '{{=it.eval("=COLUMNSPARKLINE(histogram([meanTemperature], 0))")}}' } }, { id: 'meanHumidity', caption: 'Mean Humidity', dataField: 'Mean_Humidity', minWidth: 150, presenter: '<span>{{=it.meanHumidity}}%</span>', headerRow: { renderer: '{{=it.eval("=COLUMNSPARKLINE(histogram([meanHumidity], 0))")}}' } }, { id: 'precipitationmm', caption: 'Precipitation', dataField: 'Precipitationmm', minWidth: 150, presenter: '<span>{{?isNaN(+it.precipitationmm)}}{{=it.precipitationmm}}{{??}}{{=it.precipitationmm}}mm{{?}}</span>', headerRow: { renderer: '{{=it.eval("=COLUMNSPARKLINE(histogram([precipitationmm], 0))")}}' } }]; - Initialize the code by calling the grid ID from the DIV tag.
var dataView = new GC.Spread.Views.DataView(document.getElementById('grid1'), data, columns, new GC.Spread.Views.Plugins.GridLayout({
            allowSorting: true,
            sorting: 'date',
            headerRow: {
                visible: true,
                height: 48
            }
    }));
Define the function to handle the input in the header rows.
$('.header-input input').on('keydown', function(e) {
            e.stopImmediatePropagation();
        });

        $('#grid-headerrow-position').change(function() {
            var sel = document.getElementById("grid-headerrow-position");
            var value = sel.options[sel.selectedIndex].value;
            dataView.layoutEngine.options.headerRow.position = value;
            dataView.invalidate();
        });

        $('#grid1').on('keyup', '.gc-header-row-cell input', function() {
            setFilter(getFilter());
        }).on('change', '.gc-header-row-cell select', function() {
            setFilter(getFilter());
        });

        //focus data.view by default
        document.querySelector('#grid1').focus();

        function getFilter() {
            var filter = '';
            var trans = {
                all: '',
                January: '2016-1-',
                February: '2016-2-',
                March: '2016-3-'
            };
            var val;
            var column;
            $('.header-input input').each(function() {
                val = $(this).val();
                column = $(this).closest('.gc-header-row-cell').attr('data-column');
                if (val) {
                    filter += (filter ? '&&' : '') + 'search("' + val + '",[' + column + '],1,-1) >0';
                }
            });
            $('.header-input select').each(function() {
                val = $(this).val();
                column = $(this).closest('.gc-header-row-cell').attr('data-column');
                if (val) {
                    filter += (filter ? '&&' : '') + 'search("' + trans[val] + '",[' + column + '],1,-1) >0';
                }
            });
            return filter;
        }

        function setFilter(filter) {
            if (filter !== '') {
                dataView.data.filter(filter).do();
            } else {
                dataView.data.filter().clear().do();
            }
    }
