A sunburst chart displays hierarchical datasets in graphical form with data plotted in rows and columns for multiple categories or levels.
SpreadJS supports sunburst charts in order to enable users to analyse homogenous and heterogenous data while working with tables and relational database in the worksheets. Moreover, this type of chart helps users in breaking down data into different entities for identifying and visualizing multilevel parent child relationships in different business scenarios quickly and efficiently.
Working of Sunburst Chart
Typically, a sunburst chart is created with multiple levels or categories. Each category or level is represented by a ring or a circle with the innermost circle depicting the top level, thus displaying how the outer rings (child categories or sublevels) relate to the inner rings (parent categories or top levels).
In SpreadJS, the DataPoints class represents all the dataPoints in a chart series. Datapoints can be used to represent each highest level and their sub data points in the hierarchical data.
If a sunburst chart is created with only one category or level, its appearance resembles to a doughnut chart. The sunburst chart is useful especially when users want to show how one category or level (ring) is broken into its contributing pieces.
Example
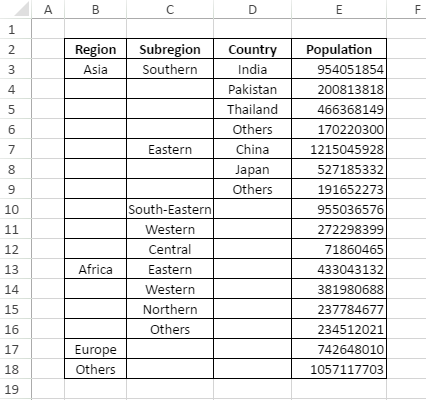
For instance, let's take an example of world population as shown in the below table with four major regions representing datapoints (top levels)- Asia, Africa, Europe and Others. These regions are further divided into subregions, which are further divided into countries with each country having unique population statistics.
When a sunburst chart is created for the above data, it becomes much easier and faster to manipulate, understand and visualize information in an effective way for comprehensive data analysis.
An image of the sunburst chart depicting world population for the above plotted data for different regions, subregions and countries is shown in the below screenshot.
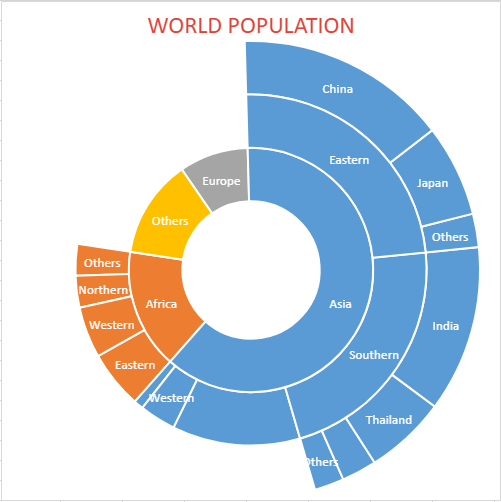
Clearly, the innermost circle depicts all the four top levels (Asia, Africa, Europe and Others) amongst which Asia is the region with highest population in the world and Europe is the region with lowest population in the world. Also, the most populous country accroding to the above chart is China in the Eastern subregion.
Using Code
This example code shows how to create sunburst chart in a spreadsheet to analyse world population.
| JavaScript |
Copy Code
|
|---|---|
|
// Creating Sunburst chart window.onload = function () { sheet.setColumnWidth(2, 100); var dataArray = [ sheet.setArray(1, 1, dataArray); GC.Spread.Sheets.Charts.ChartType.sunburst,450, 0, 500, 500, "B2:E18"); var dataPoints = chart.series().dataPoints(); { }; |
|