The point chart can be an XYZ plot such as the one shown in this figure.
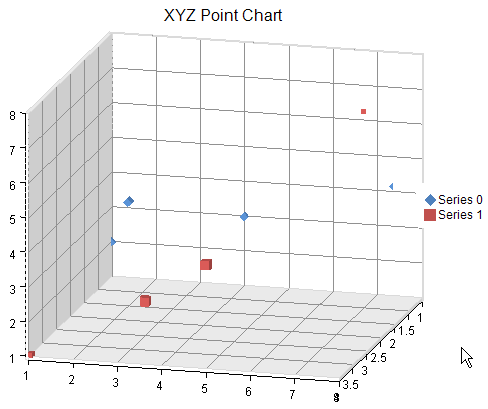
Each point in an XYZ point series has three data values: x, y, and z. Each point is visualized as point marker.
The point markers in an XYZ series or the series can be assigned a border, fill effect, shape, and a size. Settings at the point level have precedence. Assigning null for a border or fill effect indicates that the property is unset. Size is measured in model units.
For more information on the point series object in the API, refer to the XYZPointSeries class.