The line chart can be an XYZ plot such as the one shown in this figure.
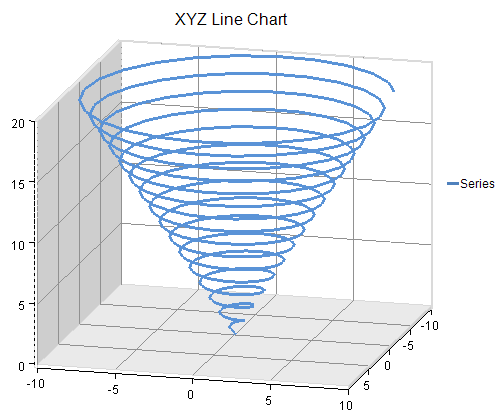
Each point in an XYZ line series has three data values: x, y, and z. Each point is visualized as a point on a line.
An XYZ line series or each point in the series can be assigned a border or a fill effect for the line. You can also specify whether the line is jagged or smooth and whether drop lines are displayed. Assigning null for a border or fill effect indicates that the property is unset.
For more information on the line series object in the API, refer to the XYZLineSeries class.