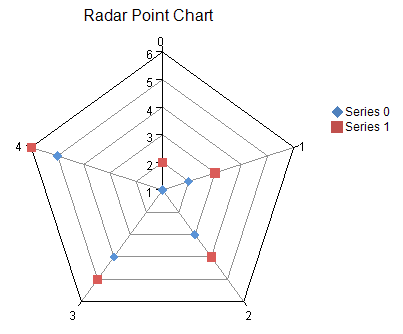
You can create a radar plot chart using code or the designer. The following image shows a Radar point type chart.
For details on the API, see the RadarPlotArea class.
The following classes are also available when creating Radar plot type charts:
Using Code
- Use the RadarPointSeries class to add data to a Chart control.
- Use the RadarPlotArea class to create the plot area.
- Set the location and size of the plot area.
- Add the series to the plot area.
- Create a label and legend for the chart.
- Create a chart model and add the plot area, label, and legend to the model.
- Create a chart and add the chart model to it.
Example
The following example demonstrates using unbound data to create a Radar chart.
| C# |
Copy Code
|
|---|---|
FarPoint.Win.Chart.RadarPointSeries series0 = new FarPoint.Win.Chart.RadarPointSeries(); series0.SeriesName = "Series 0"; series0.Values.Add(1.0); series0.Values.Add(2.0); series0.Values.Add(3.0); series0.Values.Add(4.0); series0.Values.Add(5.0); FarPoint.Win.Chart.RadarPointSeries series1 = new FarPoint.Win.Chart.RadarPointSeries(); series1.SeriesName = "Series 1"; series1.Values.Add(2.0); series1.Values.Add(3.0); series1.Values.Add(4.0); series1.Values.Add(5.0); series1.Values.Add(6.0); FarPoint.Win.Chart.RadarPlotArea plotArea = new FarPoint.Win.Chart.RadarPlotArea(); plotArea.Location = new PointF(0.2f, 0.2f); plotArea.Size = new SizeF(0.6f, 0.6f); plotArea.Series.Add(series0); plotArea.Series.Add(series1); FarPoint.Win.Chart.LabelArea label = new FarPoint.Win.Chart.LabelArea(); label.Text = "Radar Point Chart"; label.Location = new PointF(0.5f, 0.02f); label.AlignmentX = 0.5f; label.AlignmentY = 0.0f; FarPoint.Win.Chart.LegendArea legend = new FarPoint.Win.Chart.LegendArea(); legend.Location = new PointF(0.98f, 0.5f); legend.AlignmentX = 1.0f; legend.AlignmentY = 0.5f; FarPoint.Win.Chart.ChartModel model = new FarPoint.Win.Chart.ChartModel(); model.LabelAreas.Add(label); model.LegendAreas.Add(legend); model.PlotAreas.Add(plotArea); chart2DControl1.Model = model; |
|
| VB |
Copy Code
|
|---|---|
Dim series0 As New FarPoint.Win.Chart.RadarPointSeries() series0.SeriesName = "Series 0" series0.Values.Add(1.0) series0.Values.Add(2.0) series0.Values.Add(3.0) series0.Values.Add(4.0) series0.Values.Add(5.0) Dim series1 As New FarPoint.Win.Chart.RadarPointSeries() series1.SeriesName = "Series 1" series1.Values.Add(2.0) series1.Values.Add(3.0) series1.Values.Add(4.0) series1.Values.Add(5.0) series1.Values.Add(6.0) Dim plotArea As New FarPoint.Win.Chart.RadarPlotArea() plotArea.Location = New PointF(0.2F, 0.2F) plotArea.Size = New SizeF(0.6F, 0.6F) plotArea.Series.Add(series0) plotArea.Series.Add(series1) Dim label As New FarPoint.Win.Chart.LabelArea() label.Text = "Radar Point Chart" label.Location = New PointF(0.5F, 0.02F) label.AlignmentX = 0.5F label.AlignmentY = 0F Dim legend As New FarPoint.Win.Chart.LegendArea() legend.Location = New PointF(0.98F, 0.5F) legend.AlignmentX = 1F legend.AlignmentY = 0.5F Dim model As New FarPoint.Win.Chart.ChartModel() model.LabelAreas.Add(label) model.LegendAreas.Add(legend) model.PlotAreas.Add(plotArea) chart2DControl1.Model = model |
|
Using the Chart Designer
- Select the PlotArea Collection editor.
- Click the drop-down button on the right side of the Add button (lower, left side of dialog).
- Select the RadarPlotArea option and set properties as needed.