The chart control has several chart types and each type has additional views.
The following is a list of the chart types:
- Area
- Bar
- Box Whisker
- Bubble
- Column
- Doughnut
- Funnel
- Histogram
- Line
- Pareto
- Pie
- Polar
- Radar
- Stock
- Sunburst
- Treemap
- Waterfall
- XY
- XYZ
The column type has the following types of views - Clustered Column, Stacked Column, 100% Stacked Column, High Low Column, 3D Clustered Column, 3D Stacked Column, 100% 3D Stacked Column, 3D Column, 3D High Low Column, Clustered Cylinder, Stacked Cylinder, 100% Stacked Cylinder, 3D Cylinder, High Low Column Cylinder, Clustered Full Cone, Stacked Full Cone, 100% Stacked Full Cone, 3D Full Cone, High Low Column Full Cone, Clustered Full Pyramid, Stacked Full Pyramid, 100% Stacked Full Pyramid, 3D Pyramid, and High Low Column Pyramid.
The line type has the following types of views - Line, Stacked Line, 100% Stacked Line, Line with Markers, Stacked Line with Markers, 100% Stacked Line with Markers, and 3D Line.
The pie type has the following types of views - 2D Pie, 3D Pie, 2D Exploded Pie, and 3D Exploded Pie.
The bar type has the following types of views - Clustered Bar, Stacked Bar, 100% Stacked Bar, High Low Bar, 3D Clustered Bar , 3D Stacked Bar, 100% 3D Stacked Bar, 3D High Low Bar, Clustered Horizontal Cylinder, Stacked Horizontal Cylinder, 100% Stacked Horizontal Cylinder, High Low Bar Cylinder, Clustered Horizontal Full Cone, Stacked Horizontal Full Cone, 100% Stacked Horizontal, High Low Bar Full Cone, Clustered Horizontal Full Pyramid, Stacked Horizontal Full Pyramid, 100% Stacked Horizontal, and High Low Bar Pyramid.
The area type has the following types of views - Area, Stacked Area, 100% Stacked Area, High Low Area, 3D Area, 3D Stacked Area, 100% 3D Stacked Area, and 3D High Low Area.
The XY type has the following types of views - XY Point, XY Line, and XY Line with Marker.
The bubble type has the following types of views - 2D Bubble and 3D Bubble.
The stock type has the following types of views - High Low Close, Open High Low Close, and Candle Stick.
The XYZ type has the following types of views - XYZ Line, XYZ Line with Marker, XYZ Point, and Surface.
The doughnut type has the following types of views - Doughnut and Exploded Doughnut.
The radar type has the following types of views - Radar Line, Radar Line with Marker, Radar Point, and Radar Area.
The polar type has the following types of views - Polar Line, Polar Line with Marker, Polar Point, and Polar Area.
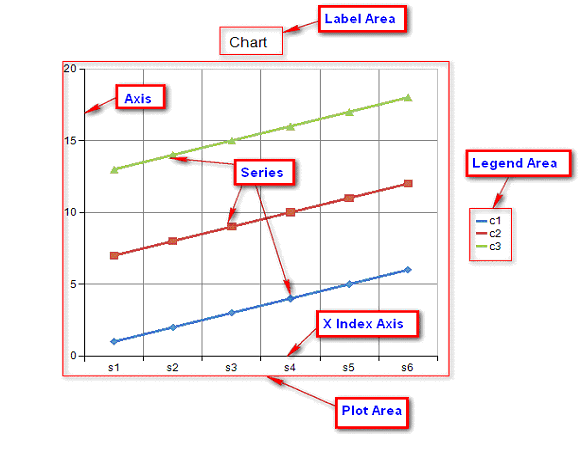
There are several visual elements to a chart such as the plot, legend, and label areas, the axis, and the series. The label area contains additional information about the chart. The legend can be used to help end users identify different chart elements such as the series. The axis displays the scale for a single dimension of a plot area. Each series is a collection of data points. The plot area is the area in which data points are drawn.