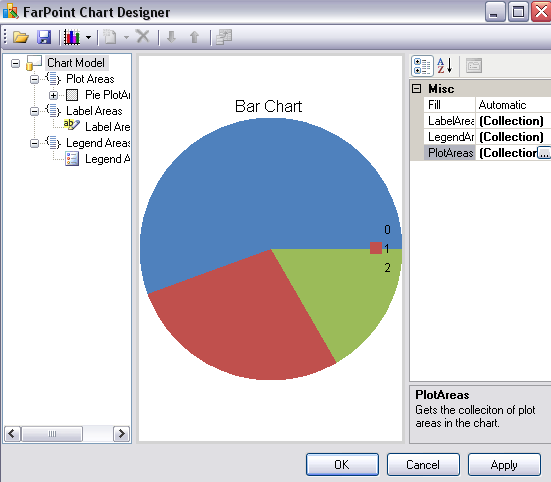
The following steps show how to create a Pie chart using the designer.
1. Open the designer (click on the arrow at the top right edge of the control when it is on a form in Visual Studio or click on the Designer menu option to load the chart designer).
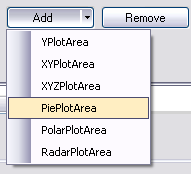
2. Click on the PlotArea Collection drop-down button. The YPlotArea is already selected. Click Remove. Then click Add and select the PiePlotArea.
3. Select the Series Collection drop-down button.
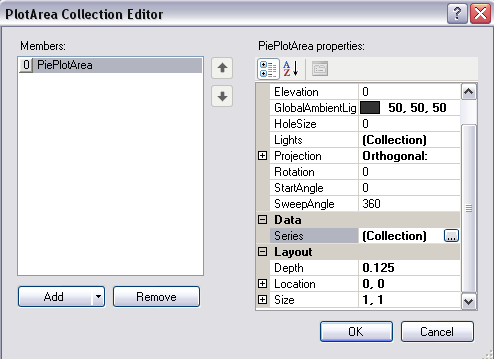
4. Click the Add button in the Series Collection Editor. Then select the Values Collection drop-down button.
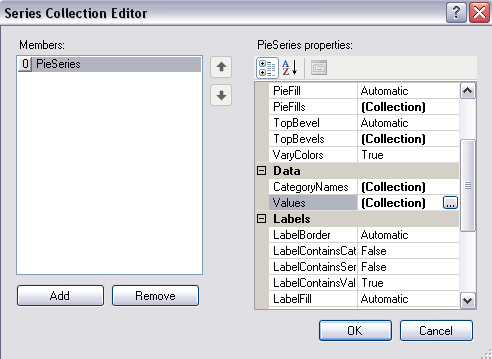
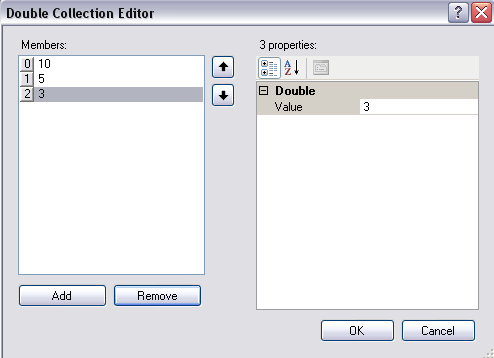
5. Click the Add button and add multiple data values. Type a double value in the text area on the right side of the editor.
6. Select OK on the three dialogs. Click Apply and OK to apply the designer changes to the control and close the designer. The LabelArea Collection editor can be used to change the text of the legend (from Bar to Pie, for example).