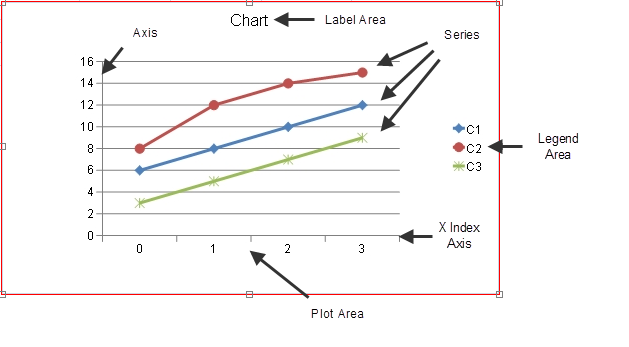
There are several visual elements to a chart such as the plot, legend, and label areas, the axis, and the series. The label area contains additional information about the chart. The legend can be used to help end users identify different chart elements such as the series. The axis displays the scale for a single dimension of a plot area. Each series is a collection of data points. The plot area is the area in which data points are drawn.
For more information about the chart elements, refer to the following topics: