You can specify the color, type, and size of the border that goes around the edge of the Chart control.
Using Code
- To set the border color, set BorderColor in the SpeadChart class.
- To set the border style, set BorderStyle in the SpeadChart class.
- To set the border width, set BorderWidth in the SpeadChart class.
Example
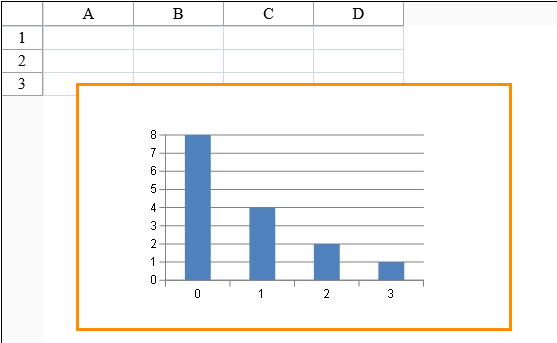
The following example creates an orange border around the Chart control.
| C# |
Copy Code
|
|---|---|
FarPoint.Web.Spread.Chart.SpreadChart chart = new FarPoint.Web.Spread.Chart.SpreadChart;
chart.BorderColor = Drawing.Color.DarkOrange;
chart.BorderStyle = BorderStyle.Solid;
chart.BorderWidth = 3;
fpSpread1.Sheets[0].Charts.Add(chart);
|
|
| VB |
Copy Code
|
|---|---|
Dim chart As New FarPoint.Web.Spread.Chart.SpreadChart() chart.BorderColor = Drawing.Color.DarkOrange chart.BorderStyle = BorderStyle.Solid chart.chart.BorderWidth = 3 FpSpread1.Sheets(0).Charts.Add(chart) |
|