Stripes can be used in a basic one-dimensional Cartesian plot such as the one shown in this figure.
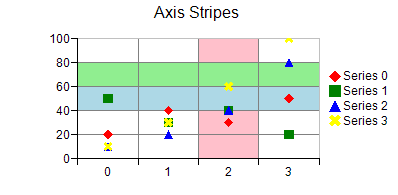
You can specify a start and end value for the stripe on the chart axis. You can also specify a fill type and color for the stripe. A stripe can be added to a chart with the axis properties in the appropriate plot area class.
For more information on the stripe object in the API, refer to the Stripe class.