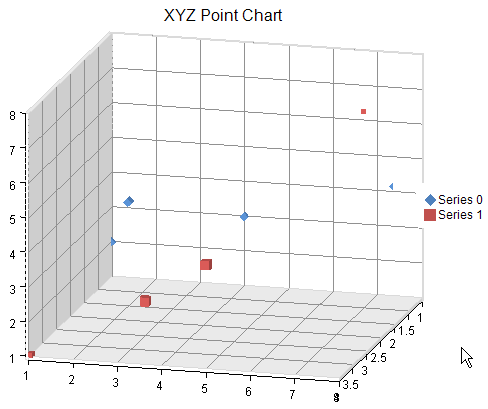
You can create an XYZ Plot Chart using code or the designer. The following image shows an XYZPlot point type chart.
For details on the API, see the XYZPlotArea class.
The following classes are also available when creating XYZ plot type charts:
Using Code
- Use the XYZPointSeries class to add data to a Chart control.
- Use the XYZPlotArea class to create the plot area.
- Set the location and size of the plot area.
- Add the series to the plot area.
- Create a label and legend for the chart.
- Create a chart model and add the plot area, label, and legend to the model.
- Create a chart and add the chart model to it.
- Add the chart to the Spread control.
Example
The following example demonstrates using unbound data to create an XYZ point chart.
| C# |
Copy Code
|
|---|---|
XYZPointSeries series0 = new XYZPointSeries(); series0.SeriesName = "Series 0"; series0.XValues.Add(1.0); series0.XValues.Add(2.0); series0.XValues.Add(4.0); series0.XValues.Add(8.0); series0.YValues.Add(2.0); series0.YValues.Add(4.0); series0.YValues.Add(3.0); series0.YValues.Add(5.0); series0.ZValues.Add(1.0); series0.ZValues.Add(2.0); series0.ZValues.Add(1.0); series0.ZValues.Add(2.0) XYZPointSeries series1 = new XYZPointSeries(); series1.SeriesName = "Series 1"; series1.XValues.Add(1.0); series1.XValues.Add(3.0); series1.XValues.Add(5.0); series1.XValues.Add(8.0); series1.YValues.Add(1.0); series1.YValues.Add(2.0); series1.YValues.Add(4.0); series1.YValues.Add(8.0); series1.ZValues.Add(4.0); series1.ZValues.Add(3.0); series1.ZValues.Add(4.0); series1.ZValues.Add(3.0); XYZPlotArea plotArea = new XYZPlotArea(); plotArea.Location = new PointF(0.2f, 0.2f); plotArea.Size = new SizeF(0.6f, 0.6f); plotArea.Series.Add(series0); plotArea.Series.Add(series1); LabelArea label = new LabelArea(); label.Text = "XYZ Point Chart"; label.Location = new PointF(0.5f, 0.02f); label.AlignmentX = 0.5f; label.AlignmentY = 0.0f; LegendArea legend = new LegendArea(); legend.Location = new PointF(0.98f, 0.5f); legend.AlignmentX = 1.0f; legend.AlignmentY = 0.5f; ChartModel model = new ChartModel(); model.LabelAreas.Add(label); model.LegendAreas.Add(legend); model.PlotAreas.Add(plotArea); FarPoint.Web.Spread.Chart.SpreadChart chart = new FarPoint.Web.Spread.Chart.SpreadChart(); chart.Model = model; FpSpread1.Sheets[0].Charts.Add(chart); |
|
| VB |
Copy Code
|
|---|---|
Dim series0 As New FarPoint.Web.Chart.XYZPointSeries() series0.SeriesName = "Series 0" series0.XValues.Add(1.0) series0.XValues.Add(2.0) series0.XValues.Add(4.0) series0.XValues.Add(8.0) series0.YValues.Add(2.0) series0.YValues.Add(4.0) series0.YValues.Add(3.0) series0.YValues.Add(5.0) series0.ZValues.Add(1.0) series0.ZValues.Add(2.0) series0.ZValues.Add(1.0) series0.ZValues.Add(2.0) Dim series1 As New FarPoint.Web.Chart.XYZPointSeries() series1.SeriesName = "Series 1" series1.XValues.Add(1.0) series1.XValues.Add(3.0) series1.XValues.Add(5.0) series1.XValues.Add(7.0) series1.YValues.Add(1.0) series1.YValues.Add(2.0) series1.YValues.Add(4.0) series1.YValues.Add(8.0) series1.ZValues.Add(4.0) series1.ZValues.Add(3.0) series1.ZValues.Add(4.0) series1.ZValues.Add(3.0) Dim plotArea As New FarPoint.Web.Chart.XYZPlotArea() plotArea.Location = New PointF(0.2F, 0.2F) plotArea.Size = New SizeF(0.6F, 0.6F) plotArea.Series.Add(series0) plotArea.Series.Add(series1) Dim label As New FarPoint.Web.Chart.LabelArea() label.Text = "XYZ Point Chart" label.Location = New PointF(0.5F, 0.02F) label.AlignmentX = 0.5F label.AlignmentY = 0.0F Dim legend As New FarPoint.Web.Chart.LegendArea() legend.Location = New PointF(0.98F, 0.5F) legend.AlignmentX = 1.0F legend.AlignmentY = 0.5F Dim model As New FarPoint.Web.Chart.ChartModel() model.LabelAreas.Add(label) model.LegendAreas.Add(legend) model.PlotAreas.Add(plotArea) Dim chart As New FarPoint.Web.Spread.Chart.SpreadChart() chart.Model = model FpSpread1.Sheets(0).Charts.Add(chart) |
|
Using the Chart Designer
- Select the PlotArea Collection editor.
- Click the drop-down button on the right side of the Add button (lower, left side of dialog)
- Select the XYZPlotArea option and set properties as needed.
- Select Apply and OK to close the Chart Designer.
See Also