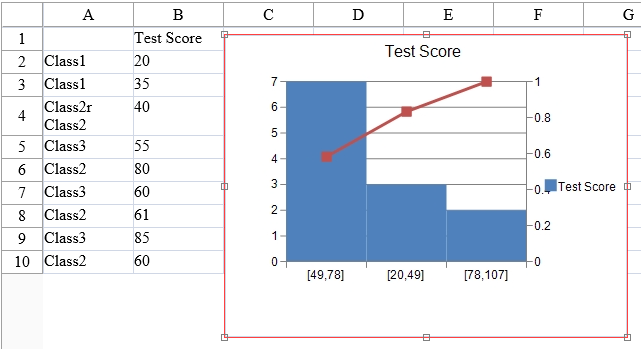
A pareto chart contains both bars and a line graph. Individual values are represented in descending order by bars and the cumulative total is represented by the line. The pareto chart is used to highlight the most important items in a set of values.
For information about creating charts in the Spread Designer or the Chart Designer, refer to Using the Spread Designer or Using the Chart Designer.
Using Code
- Add data to the control.
- Add a chart to the Spread control using the ParetoSeries class.
Example
The following example creates a pareto chart.
| C# |
Copy Code
|
|---|---|
FpSpread1.ActiveSheetView.RowCount = 30; FpSpread1.ActiveSheetView.ColumnCount = 10; FpSpread1.ActiveSheetView.Cells[0, 1].Text = "Test Score"; FpSpread1.ActiveSheetView.SetClipValue(1, 0, 13, 1, "Class1\r\nClass1\r\nClass2r\nClass2\r\nClass3\r\nClass2\r\nClass3\r\nClass2\r\nClass3\r\nClass2\r\nClass2\r\nClass3"); FpSpread1.ActiveSheetView.SetClipValue(1, 1, 13, 1, "20\r\n35\r\n40\r\n55\r\n80\r\n60\r\n61\r\n85\r\n60\r\n60\r\n64\r\n75"); FpSpread1.ActiveSheetView.AddChart(new FarPoint.Web.Spread.Model.CellRange(0, 0, 13, 2), typeof(FarPoint.Web.Chart.ParetoSeries), 400, 300, 150, 0); |
|
| VB |
Copy Code
|
|---|---|
FpSpread1.ActiveSheetView.RowCount = 30 FpSpread1.ActiveSheetView.ColumnCount = 10 FpSpread1.ActiveSheetView.Cells(0, 1).Text = "Test Score" FpSpread1.ActiveSheetView.SetClipValue(1, 0, 13, 1, "Class1" & vbCr & vbLf & "Class1" & vbCr & vbLf & "Class2r" & vbLf & "Class2" & vbCr & vbLf & "Class3" & vbCr & vbLf & "Class2" & vbCr & vbLf & "Class3" & vbCr & vbLf & "Class2" & vbCr & vbLf & "Class3" & vbCr & vbLf & "Class2" & vbCr & vbLf & "Class2" & vbCr & vbLf & "Class3") FpSpread1.ActiveSheetView.SetClipValue(1, 1, 13, 1, "20" & vbCr & vbLf & "35" & vbCr & vbLf & "40" & vbCr & vbLf & "55" & vbCr & vbLf & "80" & vbCr & vbLf & "60" & vbCr & vbLf & "61" & vbCr & vbLf & "85" & vbCr & vbLf & "60" & vbCr & vbLf & "60" & vbCr & vbLf & "64" & vbCr & vbLf & "75") FpSpread1.ActiveSheetView.AddChart(New FarPoint.Web.Spread.Model.CellRange(0, 0, 13, 2), GetType(FarPoint.Web.Chart.ParetoSeries), 400, 300, 150, 0) |
|
Using the Chart Designer
- Select the PlotArea Collection editor.
- Set properties as needed.
- Select Apply and OK to close the Chart Designer.