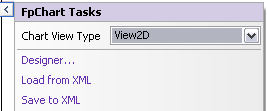
You can create a Chart control with code or with the Chart Designer. Select the Chart control, click on the chart verb, and then select Designer to bring up the Chart Designer.
You can also create a chart with code. The code is similar to using the Chart control in Spread; however, you do not need the AddChart method in this case.
Using Code
- Use the BarSeries class to add data to a Chart control.
- Use the YPlotArea class to create a plot area.
- Set the location and size of the plot area.
- Add the series to the plot area.
- Create a label and legend for the chart.
- Create a chart model and add the plot area, label, and legend to the model.
- Add the chart model to the Chart control.
Example
The following example creates a bar type chart with a label and legend.
| C# |
Copy Code
|
|---|---|
FarPoint.Web.Chart.BarSeries series = new FarPoint.Web.Chart.BarSeries(); series.SeriesName = "Series 0"; series.Values.Add(2.0); series.Values.Add(4.0); series.Values.Add(3.0); series.Values.Add(5.0); FarPoint.Web.Chart.YPlotArea plotArea = new FarPoint.Web.Chart.YPlotArea(); plotArea.Location = new System.Drawing.PointF(0.2f, 0.2f); plotArea.Size = new System.Drawing.SizeF(0.6f, 0.6f); plotArea.Series.Add(series); FarPoint.Web.Chart.LabelArea label = new FarPoint.Web.Chart.LabelArea(); label.Text = "Bar Chart"; label.Location = new System.Drawing.PointF(0.5f, 0.02f); label.AlignmentX = 0.5f; label.AlignmentY = 0.0f; FarPoint.Web.Chart.LegendArea legend = new FarPoint.Web.Chart.LegendArea(); legend.Location = new System.Drawing.PointF(0.98f, 0.5f); legend.AlignmentX = 1.0f; legend.AlignmentY = 0.5f; FarPoint.Web.Chart.ChartModel model = new FarPoint.Web.Chart.ChartModel(); model.LabelAreas.Add(label); model.LegendAreas.Add(legend); model.PlotAreas.Add(plotArea); FpChart1.Model = model; |
|
| VB |
Copy Code
|
|---|---|
Dim series As New FarPoint.Web.Chart.BarSeries() series.SeriesName = "Series 0" series.Values.Add(2.0) series.Values.Add(4.0) series.Values.Add(3.0) series.Values.Add(5.0) Dim plotArea As New FarPoint.Web.Chart.YPlotArea() plotArea.Location = New System.Drawing.PointF(0.2f, 0.2f) plotArea.Size = New System.Drawing.SizeF(0.6f, 0.6f) plotArea.Series.Add(series) Dim label As New FarPoint.Web.Chart.LabelArea() label.Text = "Bar Chart" label.Location = New System.Drawing.PointF(0.5f, 0.02f) label.AlignmentX = 0.5f label.AlignmentY = 0.0f Dim legend As New FarPoint.Web.Chart.LegendArea() legend.Location = New System.Drawing.PointF(0.98f, 0.5f) legend.AlignmentX = 1.0f legend.AlignmentY = 0.5f Dim model As New FarPoint.Web.Chart.ChartModel() model.LabelAreas.Add(label) model.LegendAreas.Add(legend) model.PlotAreas.Add(plotArea) FpChart1.Model = model |
|
See Also