In this tutorial, you will see an important new functionality that TDataLite adds to ComponentOne True DBGrid 8.0 (OLE DB version). This functionality has many names, such as Data Analysis, Decision Support, On-Line Analytical Processing (OLAP), Pivot Table, Decision Cube, etc.
The essence is to allow end-users to explore data in different projections and hierarchies. The user can interactively choose and reorder the dimensions in which data are represented and summarized. An OLAP front-end, a pivot table browser/grid displays data in a hierarchical crosstab view.
With TDataLite, True DBGrid 8.0 becomes an OLAP front-end control. It gives you important advantages over other existing OLAP solutions:
-
You no longer have to rely on external tools adding OLAP functionality to your applications, you can use the same grid control that you always have, with the same familiar object model.
-
True DBGrid is fully customizable and programmable in OLAP (Pivot) mode, as it is in all other modes. You can make your OLAP solutions look and feel the same as other parts of your application, so your users won’t need to learn additional, external tools and user interface.
TDataLite Pivot mode uses ADO MD (Microsoft ActiveX Data Objects (Multi-Dimensional)) that works with an OLAP-enabled OLE DB provider, such as Microsoft OLAP Services. These components must be installed on the client computer. The easiest way to guarantee it is to install Microsoft Office 2000 (Microsoft Excel and MS Query). In this tutorial, we will use Office applications, Microsoft Excel and Microsoft Query to prepare data (OLAP cube)
 |
Note: You can use TDataLite in Pivot mode with other, third-party data bound controls that are able to display hierarchical OLE DB data. However, using it with ComponentOne True DBGrid allows you to benefit from close integration between the two controls, as you will see in the design time steps of this tutorial. If you decide to use TDataLite Pivot mode with data-bound controls other than TDBGrid, TDataLite.PivotFieldsAllLevels property must be set to False. |
-
Prepare an OLAP cube based on an SQL query from Orders and Order Details tables (also using Customers, Categories and Products tables for descriptions) with the following dimensions: Country, CompanyName, CategoryName, ProductName, and the following measures: Sum Of Quantity, Sum Of ExtendedPrice (where ExtendedPrice = Quantity * UnitPrice * (1 – Discount)).
Do it using Microsoft Excel 2000, with PivotTable and PivotChart Wizard (in the Data menu): choose “External Data Source” in step 1, invoke Microsoft Query in step 2, then formulate the query and select the Create OLAP Cube option in the File menu of Microsoft Query. This will invoke the OLAP Cube Wizard. Select ExtendedPrice and Quantity in step 1, select all four dimensions in step 2 and save the cube in a file in step 3.
We do not describe the steps in creating the cube in detail, because they are not specific to TDataLite. You are probably familiar with this procedure already. If not, consult Microsoft Excel documentation. Or you can just leave it for now and use the pre-built cube, ORDERS.CUB that can be found in the Tutorial10\Data subdirectory.
-
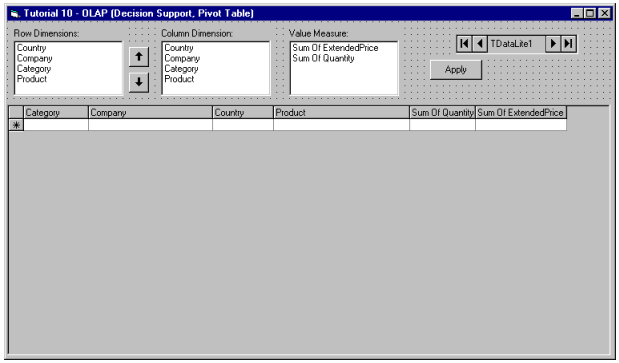
Place the following controls on the form (Form10) as shown in the figure: a TDataLite control (TDataLite1), a True DBGrid 8.0 control (TDBGrid1), three labels (Label1-3), three list boxes (List1-3) and three command buttons (Command1-3).
-
Set TDataLite1 properties as follows:
Example Title Copy CodePivot True PivotConnectionString DATA SOURCE=C:\Program Files\ComponentOne\True DataControl Lite 8.0\Tutorials\Tutor10\data\orders.cub;Provider=msolap; PivotCubeName OCWCube
TDataLite Pivot mode is special in that only these three properties are relevant at design time. All the rest, including all the properties specified in TDataLite Property Pages, are ignored in Pivot mode.
Set TDBGrid1 properties as follows:
Example Title Copy CodeDataSource TDataLite1 DataView 1 - Hierarchical
Note: It is essential that True DBGrid is used in Hierarchical mode, since OLAP structure is inherently hierarchical.
-
Select Retrieve Fields from TDBGrid1 context menu. The following columns will appear: Category, Company, Country, Product, Sum Of Quantity, Sum Of ExtendedPrice. First four are dimensions, last two are measures.
This is design-time layout. You have one column for each dimension and measure of the cube, so you can specify their properties to customize their run-time appearance and behavior.
At run time, the grid column layout will be different. Grid columns will be divided into two splits. The first split will show one or more dimensions chosen by the user as row dimensions (specified in the PivotRowDimensions property) in a hierarchical view with expandable/collapsible nodes. The second split will show the data (measure specified in the PivotMeasure property) in a crosstab view, one column for each value of the column dimension (dimension specified in the PivotColumnDimension property). The “default” values, displayed in a special “All” row, that remain visible when the row is collapsed, are sums (or other aggregates, according to the measure definition) of all subordinate rows. It is possible and customary that not all dimensions participate either as a row or column dimension, some can be omitted from the user selection. Columns corresponding to such dimensions will be invisible, and corresponding data will be aggregated.
As with TDataLite crosstab feature (see Tutorial 2), all run-time crosstab columns inherit design-time property setting of the corresponding measure column, but these settings can be programmatically changed at run time. For example, setting PivotColumnDimension to “Country” will generate multiple crosstab columns: All, Austria, Belgium, Brazil, etc. All these columns will be created with settings inherited from the Sum Of ExtendedPrice column (supposing PivotMeasure = “Sum Of ExtendedPrice”).
-
Resize the columns to your liking (select Edit from TDBGrid1 context menu).
-
Open TDBGrid1 Property Pages. In the Columns page, for Columns(05) [Sum Of Extended Price], set NumberFormat=Currency. In the Splits page, open Splits(00).Columns node, then open Columns(05) [Sum Of Extended Price] node and set ForeColor = Dark Blue (Color Set: Standard Colors).
At run time, you will see that crosstab columns use these color settings. For example, setting PivotColumnDimension to “Category” will generate multiple crosstab columns: All, Beverages, Condiments, Confections, etc. If selected PivotMeasure is “Sum Of ExtendedPrice”, then all these columns will show the dollar sign according to NumberFormat=Currency and use Dark Blue text color.
-
All the powerful versatile features of True DBGrid are available in Pivot mode. To see how you can customize your decision support grid, add the following event code:
Example Title Copy CodePrivate Sub TDBGrid1_FetchCellStyle(ByVal Condition As Integer, ByVal Split As Integer, Bookmark As Variant, ByVal Col As Integer, ByVal CellStyle As TrueOleDBGrid70.StyleDisp) ' Values greater than $2,000 shown with green backcolor If TDBGrid1.Columns(Col).CellText(Bookmark) = "" Then Exit Sub If TDBGrid1.Columns(Col).CellValue(Bookmark) > 2000 Then CellStyle.BackColor = vbGreen End If End SubAt run time, you will see that all price values higher $2,000 are highlighted in green.
-
As it was said above, the grid will show data organized in row hierarchy and column crosstab according to user choice. Add the following code to the form’s Load event to specify the initial dimensions:
Example Title Copy CodePrivate Sub Form_Load() ' Initial dimensions List1.Selected(0) = True List1.Selected(1) = True List2.ListIndex = 2 List3.ListIndex = 0 TDataLite1.PivotRowDimensions = "Country,Company" TDataLite1.PivotColumnDimension = "Category" TDataLite1.PivotMeasure = "Sum Of ExtendedPrice" TDataLite1.PivotOpen End SubAt run-time, when the form is shown, the data, values of the Sum Of ExtendedPrice measure, will be initially organized into Country,Company hierarchy, with Category crosstab – one crosstab column for each Category value: All, Beverages, Condiments, Confections, etc.
-
Finally, we need to provide means for the user to change the dimension layout at run time. You can do it in many ways, only your imagination is the limit, but for this tutorial we have chosen a simple user interface: three list boxes for selecting row dimensions, column dimension and measure. Pressing the Apply button (Command1) refreshes the grid with the new selected layout.
Fill the strings in the List property for each of the three list boxes as shown in the figure: Country, Company, Category, Product for List1-2; Sum Of Extended Price, Sum of Quantity for List3.
List1 is for Row Dimensions. It is a multi-selection list box (set its MultiSelect property to 2 – Extended) allowing the user to choose one or more dimensions for row hierarchy. Two command buttons (Command2-3; we gave them arrow bitmap pictures in the tutorial, but that is not necessary, of course) allow the user to rearrange items in List1, that is, to change the row hierarchy order.
List2 is for Column Dimensions. It is a single-selection list box for choosing the dimension for crosstab. Simple code (see Sub AdjustSelection in the code below) prevents the user from selecting a dimension both in List1 and List2.
List3 is for Measures. It allows the user to select one of the two measures: Sum Of Extended Price or Sum of Quantity.
Fill in the following event code:
Example Title Copy CodePrivate Sub Command1_Click() ' Applying the query Screen.MousePointer = vbHourglass TDataLite1.PivotRowDimensions = "" For I = 0 To List1.ListCount - 1 If List1.Selected(I) Then If TDataLite1.PivotRowDimensions <> "" Then TDataLite1.PivotRowDimensions = TDataLite1.PivotRowDimensions & "," End If TDataLite1.PivotRowDimensions = TDataLite1.PivotRowDimensions & List1.List(I) End If Next I If TDataLite1.PivotRowDimensions = "" Then MsgBox "Select at least one item in Row Dimensions" Exit Sub End If TDataLite1.PivotColumnDimension = "" If List2.ListIndex <> -1 Then TDataLite1.PivotColumnDimension = List2.List(List2.ListIndex) End If TDataLite1.PivotMeasure = "" If List3.ListIndex <> -1 Then TDataLite1.PivotMeasure = List3.List(List3.ListIndex) End If TDataLite1.PivotOpen Screen.MousePointer = vbArrow End Sub Private Sub AdjustSelections() ' Preventing the user from selecting a dimension both in List1 and List2 ColDim = "" If List2.ListIndex <> -1 Then ColDim = List2.List(List2.ListIndex) End If For I = 0 To List1.ListCount - 1 If List1.Selected(I) And List1.List(I) = ColDim Then List1.Selected(I) = False End If Next I End Sub Private Sub List1_Click() AdjustSelections End Sub Private Sub List2_Click() AdjustSelections End Sub Private Sub Command3_Click() ' Changing the row hierarchy: moving a dimension down in the list If List1.SelCount <> 1 Then Exit Sub For I = 0 To List1.ListCount - 2 If List1.Selected(I) Then NextDim = List1.List(I + 1) List1.List(I + 1) = List1.List(I) List1.List(I) = NextDim List1.Selected(I) = False List1.Selected(I + 1) = True Exit For End If Next I End Sub Private Sub Command2_Click() ' Changing the row hierarchy: moving a dimension up in the list If List1.SelCount <> 1 Then Exit Sub For I = 1 To List1.ListCount - 1 If List1.Selected(I) Then NextDim = List1.List(I - 1) List1.List(I - 1) = List1.List(I) List1.List(I) = NextDim List1.Selected(I) = False List1.Selected(I - 1) = True Exit For End If Next I End SubRun the Program and Observe the Following:
-
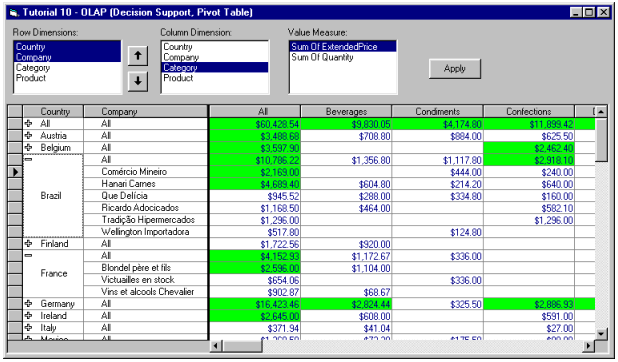
The initial display shows Country and Company row hierarchy, according to the initial settings. Each row represents a country, with columns (crosstab) representing product categories: All, Beverages, Condiments, Confections, etc. Crosstab cells display the dollar amount, Sum Of ExtendedPrice for a particular country and category. A special column named “All” displays the sum for all categories, and there is also a special row called “All” displaying the sum for all countries.
-
Expanding a country row (clicking the ‘+’ sign in the Country column, try expanding Brazil, for example), you can see data for all companies in that country.
-
Note that all amounts greater than $2,000 are highlighted with green color. This is implemented in code with the FetchCellStyle event handler.
-
Change the dimension hierarchy and layout: select Country in List2 (Column Dimension), then select Category and Product in List1 (Row Dimensions), and select Sum Of Quantity in List3 (Value Measure). Press the Apply button.
-
You see that the column and data layout has changed: the row hierarchy is now Category,Product, and crosstab columns represent countries: All, Austria, Belgium, Brazil, etc. Try expanding a row (clicking the ‘+’ sign, try expanding Beverages, for example) to see data for all products in a certain category.
-
Experiment with our decision support system, varying Row and Column Dimensions and Value Measure. Think of the power of On-Line Analytical Processing you can now deliver to your customers with True DBGrid 8.0 and True DataLite 8.0!
Congratulations, you have completed all ten TDataLite tutorials! You are now ready to take full advantage of True DataControl Lite in your applications.