Displaying 4D Data
Also, see Creating 4D Charts
3D Chart enables you to display four-dimensional data by representing the fourth dimension as color.
To display four-dimensional data, do the following:
· Specify the first three dimensions of the data by setting the ElevationData property of the ChartGroup object. For details on how to define three-dimensional data, see Working With Data.
· Set the fourth dimension by setting the ContourData property of the ChartGroup object.
For example, the following code sets the third and fourth coordinates of the point in the second row and first column to 1.55 and 1.75 respectively:
With Chart3D1.ChartGroups(1)
.ElevationData.Value(2, 1) = 1.55
.ContourData.Value(2, 1) = 1.75
End With
The ContourData property, like the ElevationData property, is of type Chart3DData. For the 4D chart to display properly, the following properties of ContourData must be set:
· The Layout property must be set to the same value as its ElevationData equivalent.
· The RowCount, ColumnCount, RowOrigin, ColumnOrigin, RowDelta and ColumnDelta properties must be set to identical values in both ContourData and ElevatedData.
If either of the above conditions are not met, the 4D chart will not be displayed.
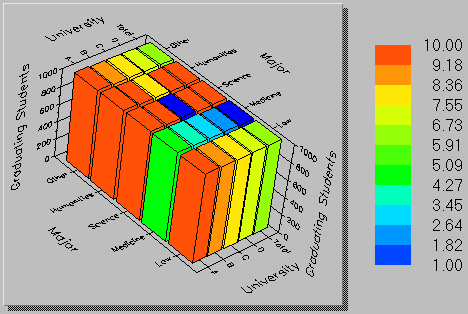
In bar charts, each bar is displayed as a single solid color according to the zoned height of the bar.
In plots, the fourth dimension is displayed as zoning and contouring colors:
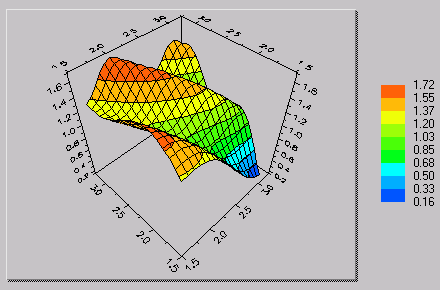
If any of the fourth-dimensional coordinates are missing (if any Value in the ContourData is set to the value of the HoleValue property), the surface in the region of the hole will be displayed as if the fourth dimension was not attached.