Adding and Formatting Grid Lines
Displaying a grid on a chart can make it easier to see the exact value of data points. For each axis, you can add grid lines to one or both planes of the PlotCube.
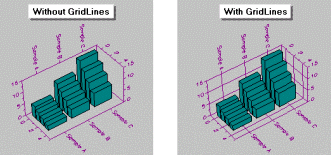
Grid lines are a property of an axis, drawn along and perpendicular to it. The grid is drawn wherever annotation appears on the axis.
 Adding Grid Lines